Overview
Kubiks is an AI-powered observability platform for Vercel apps. It automatically traces every part of your stack — API routes, database queries, background jobs, and LLM calls — using OpenTelemetry for full visibility with zero setup. Key Features:- AI Agent that monitors your stack, detects issues, and generates PRs with fixes
- Automatic Tracing across logs, traces, and source code
- Real-time Root-Cause Analysis and incident summaries
- Unified Dashboard for complete system visibility
- Slack Integration to chat with the agent and trigger actions
Quick Setup
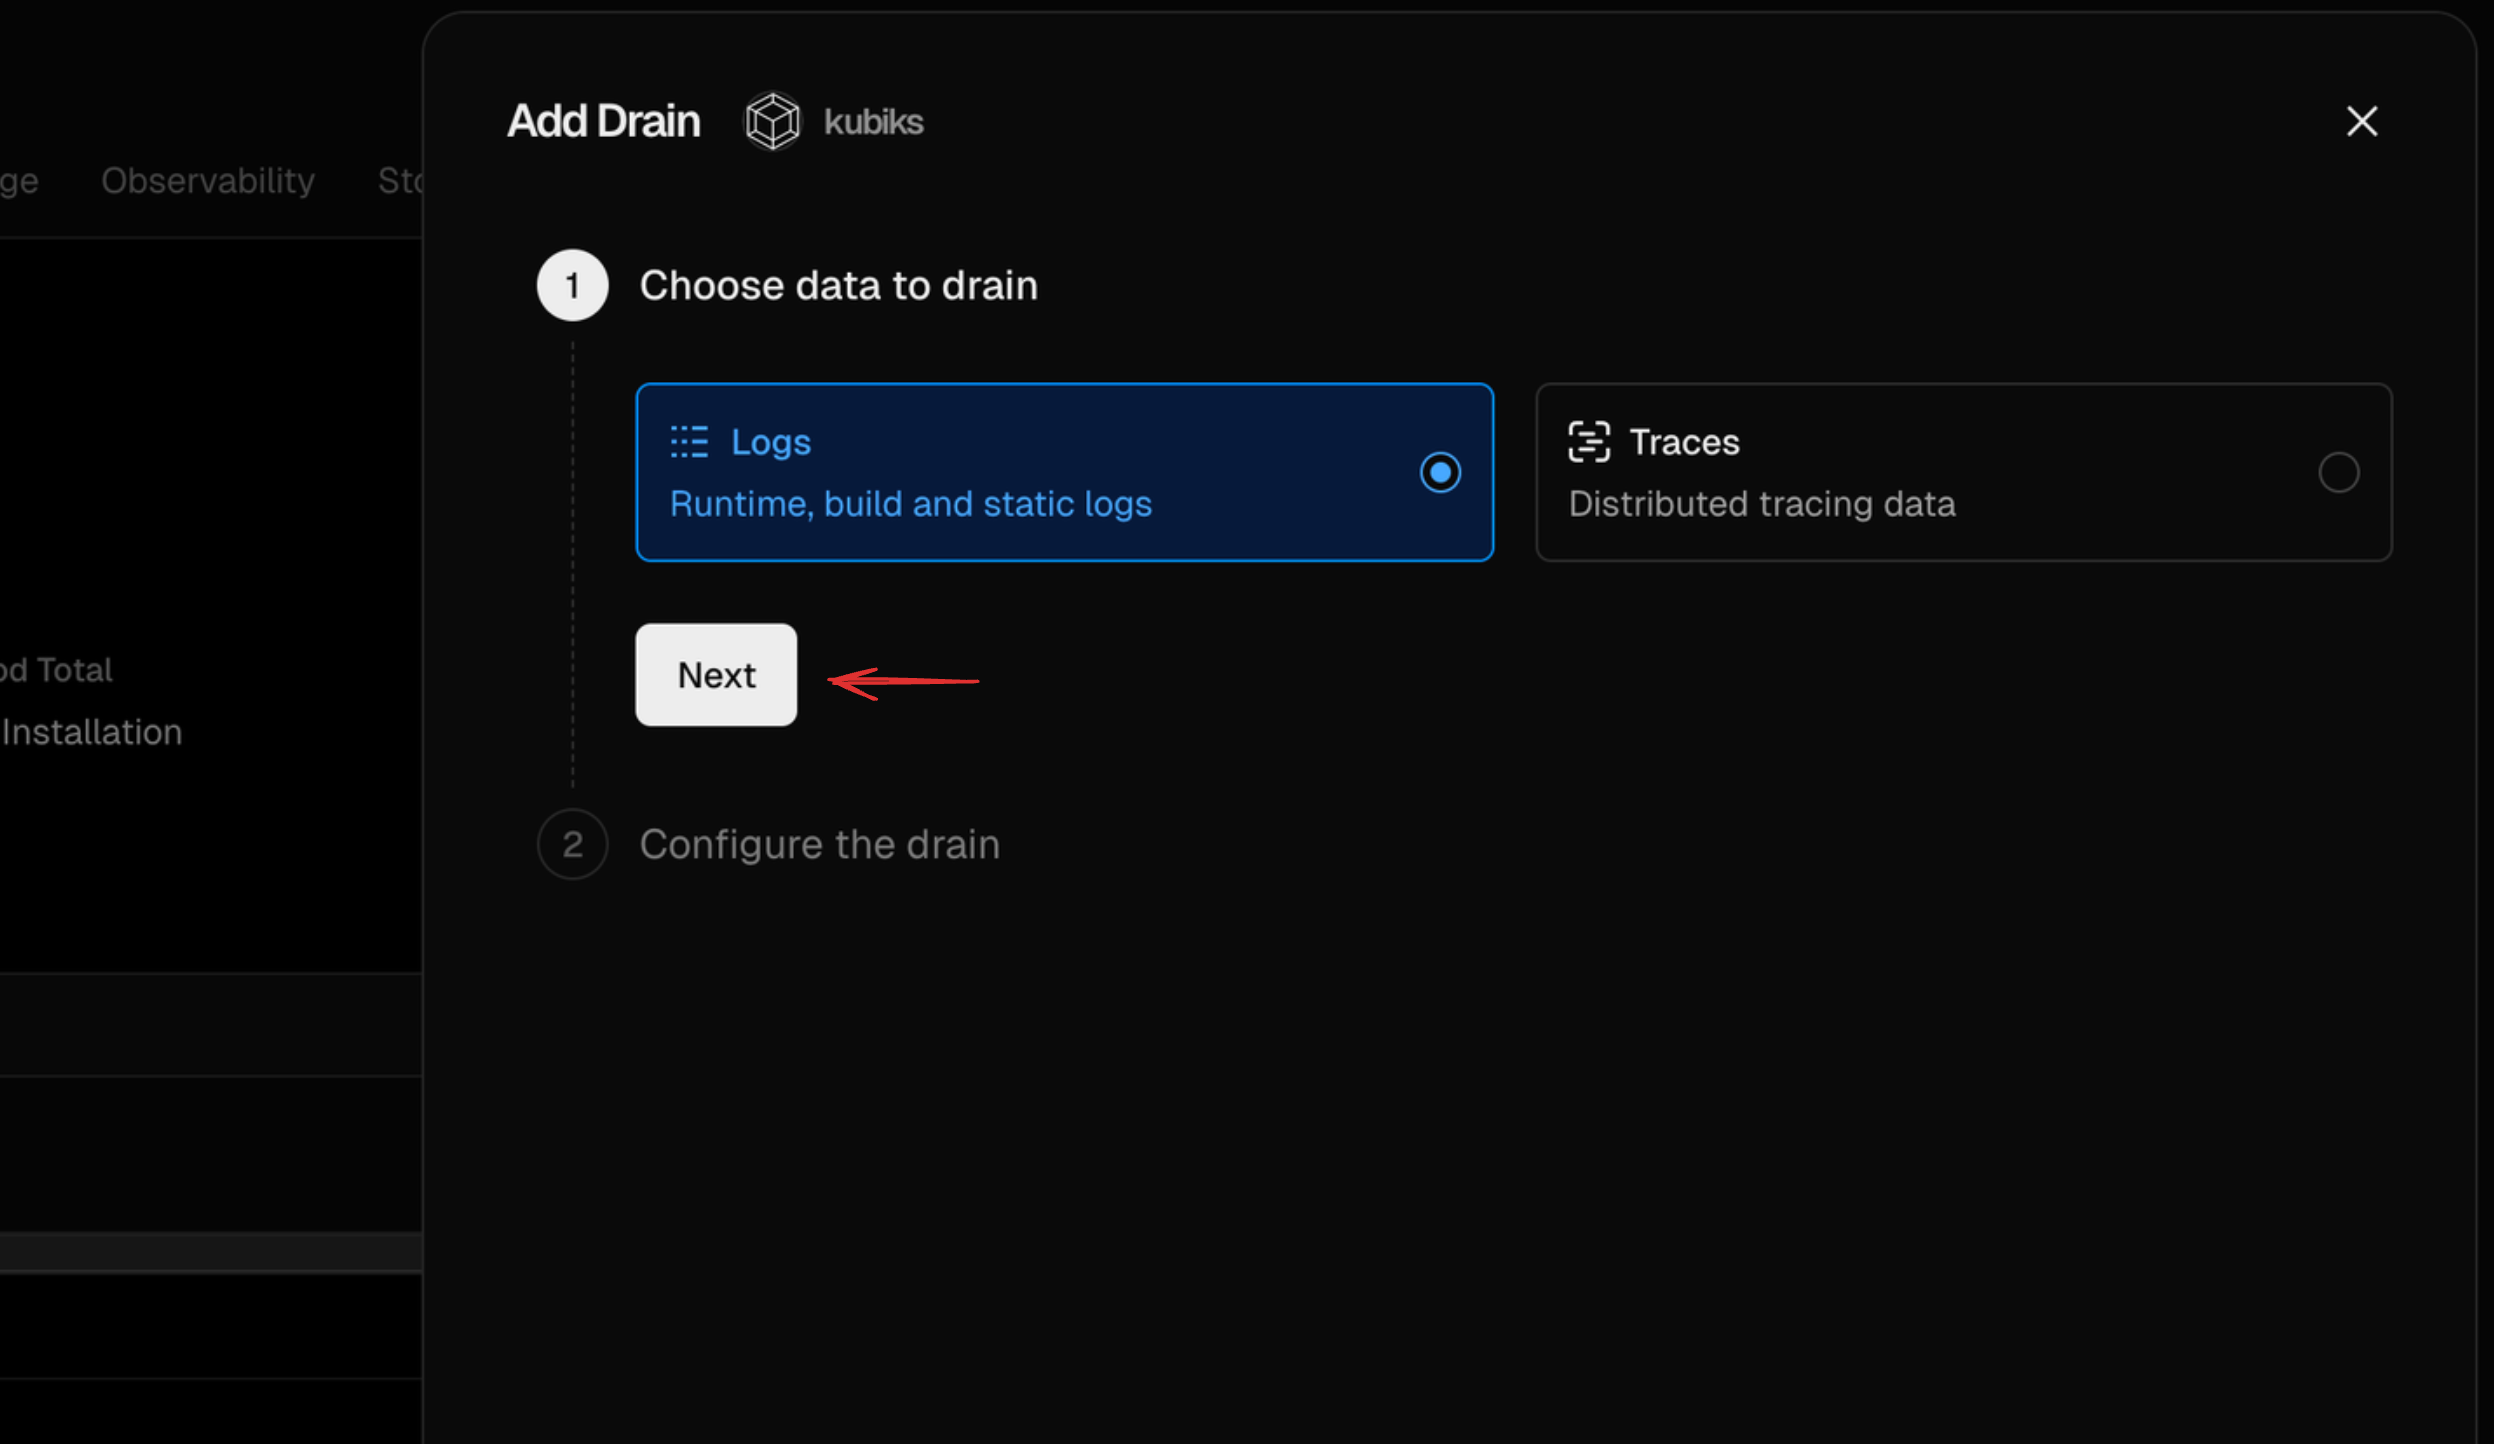
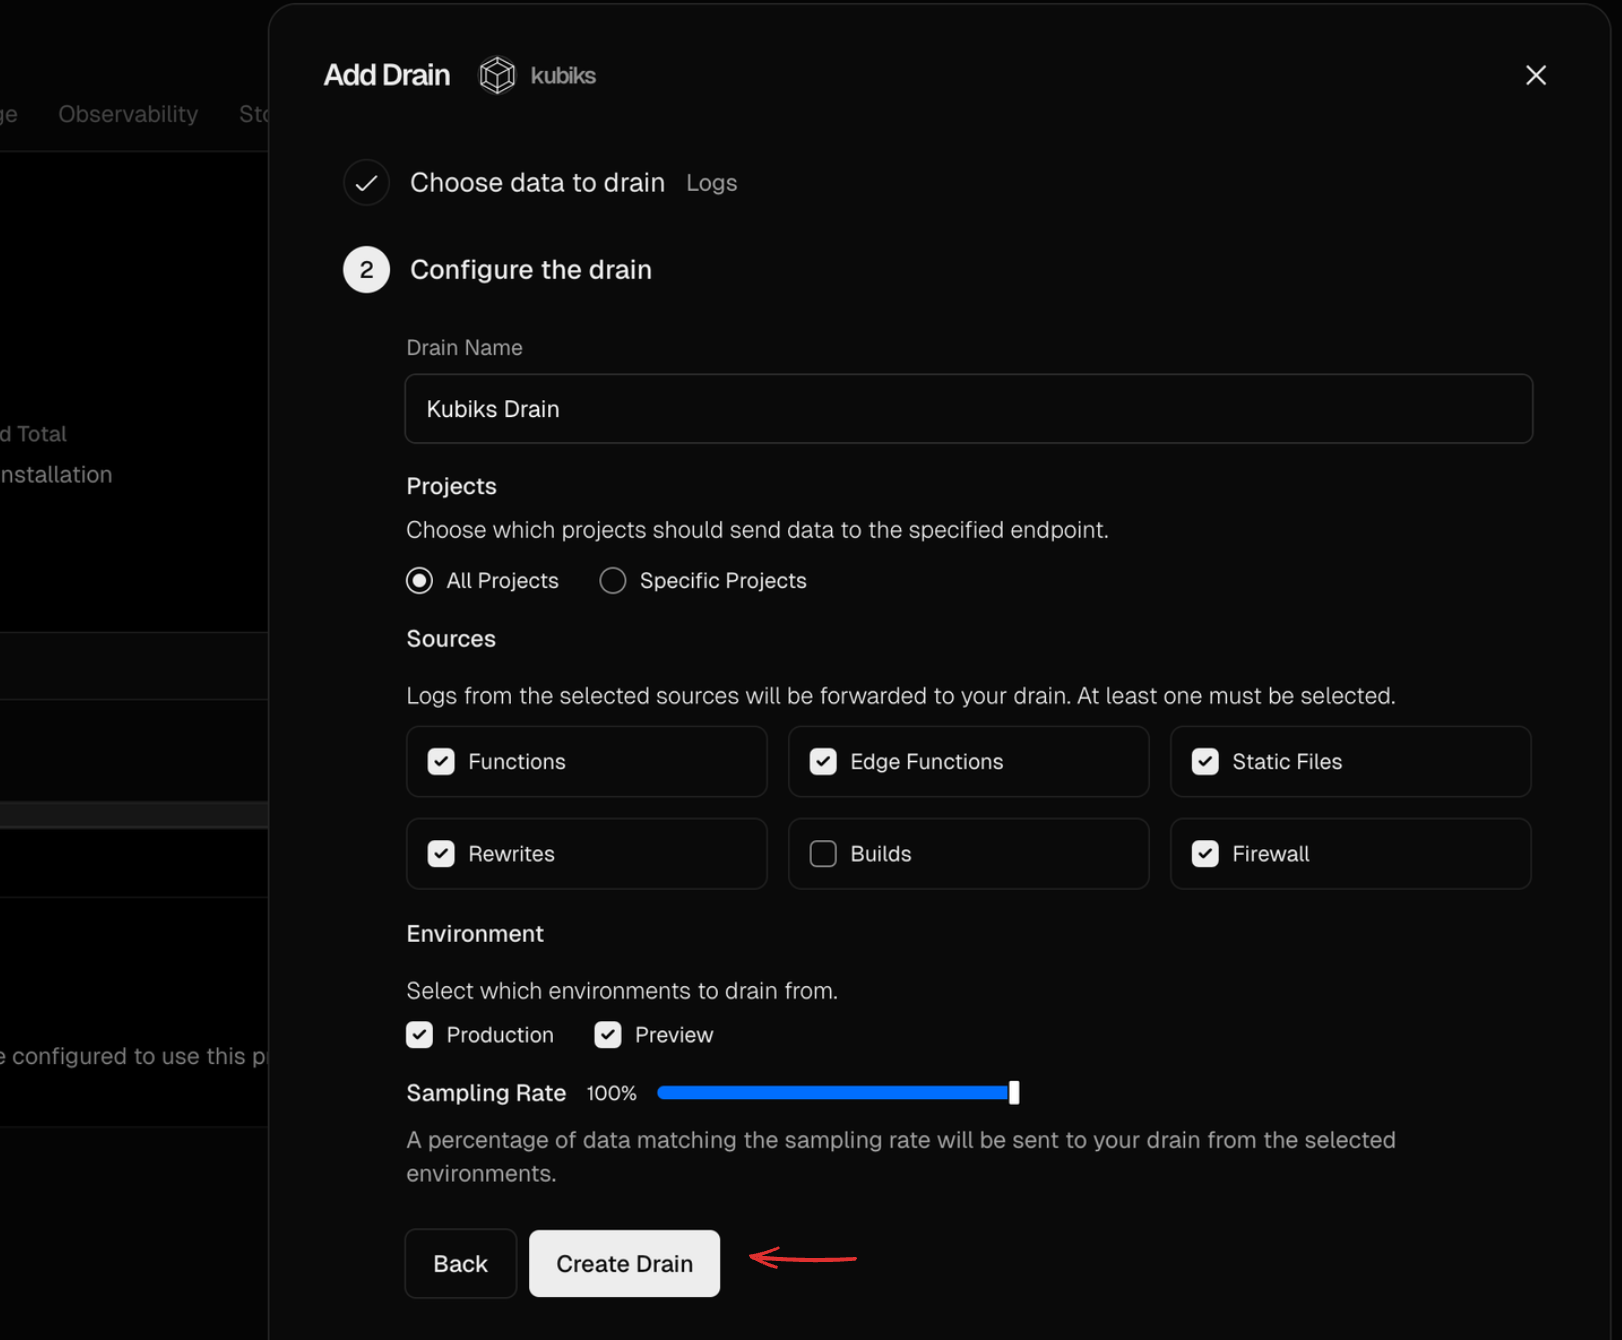
1. Enable Log Drains (Required)
Vercel Log Drains automatically forward your application’s real-time logs (build, edge, serverless, runtime, and static) to Kubiks. Log Drains are required for Kubiks to display all requests and correlate them with traces.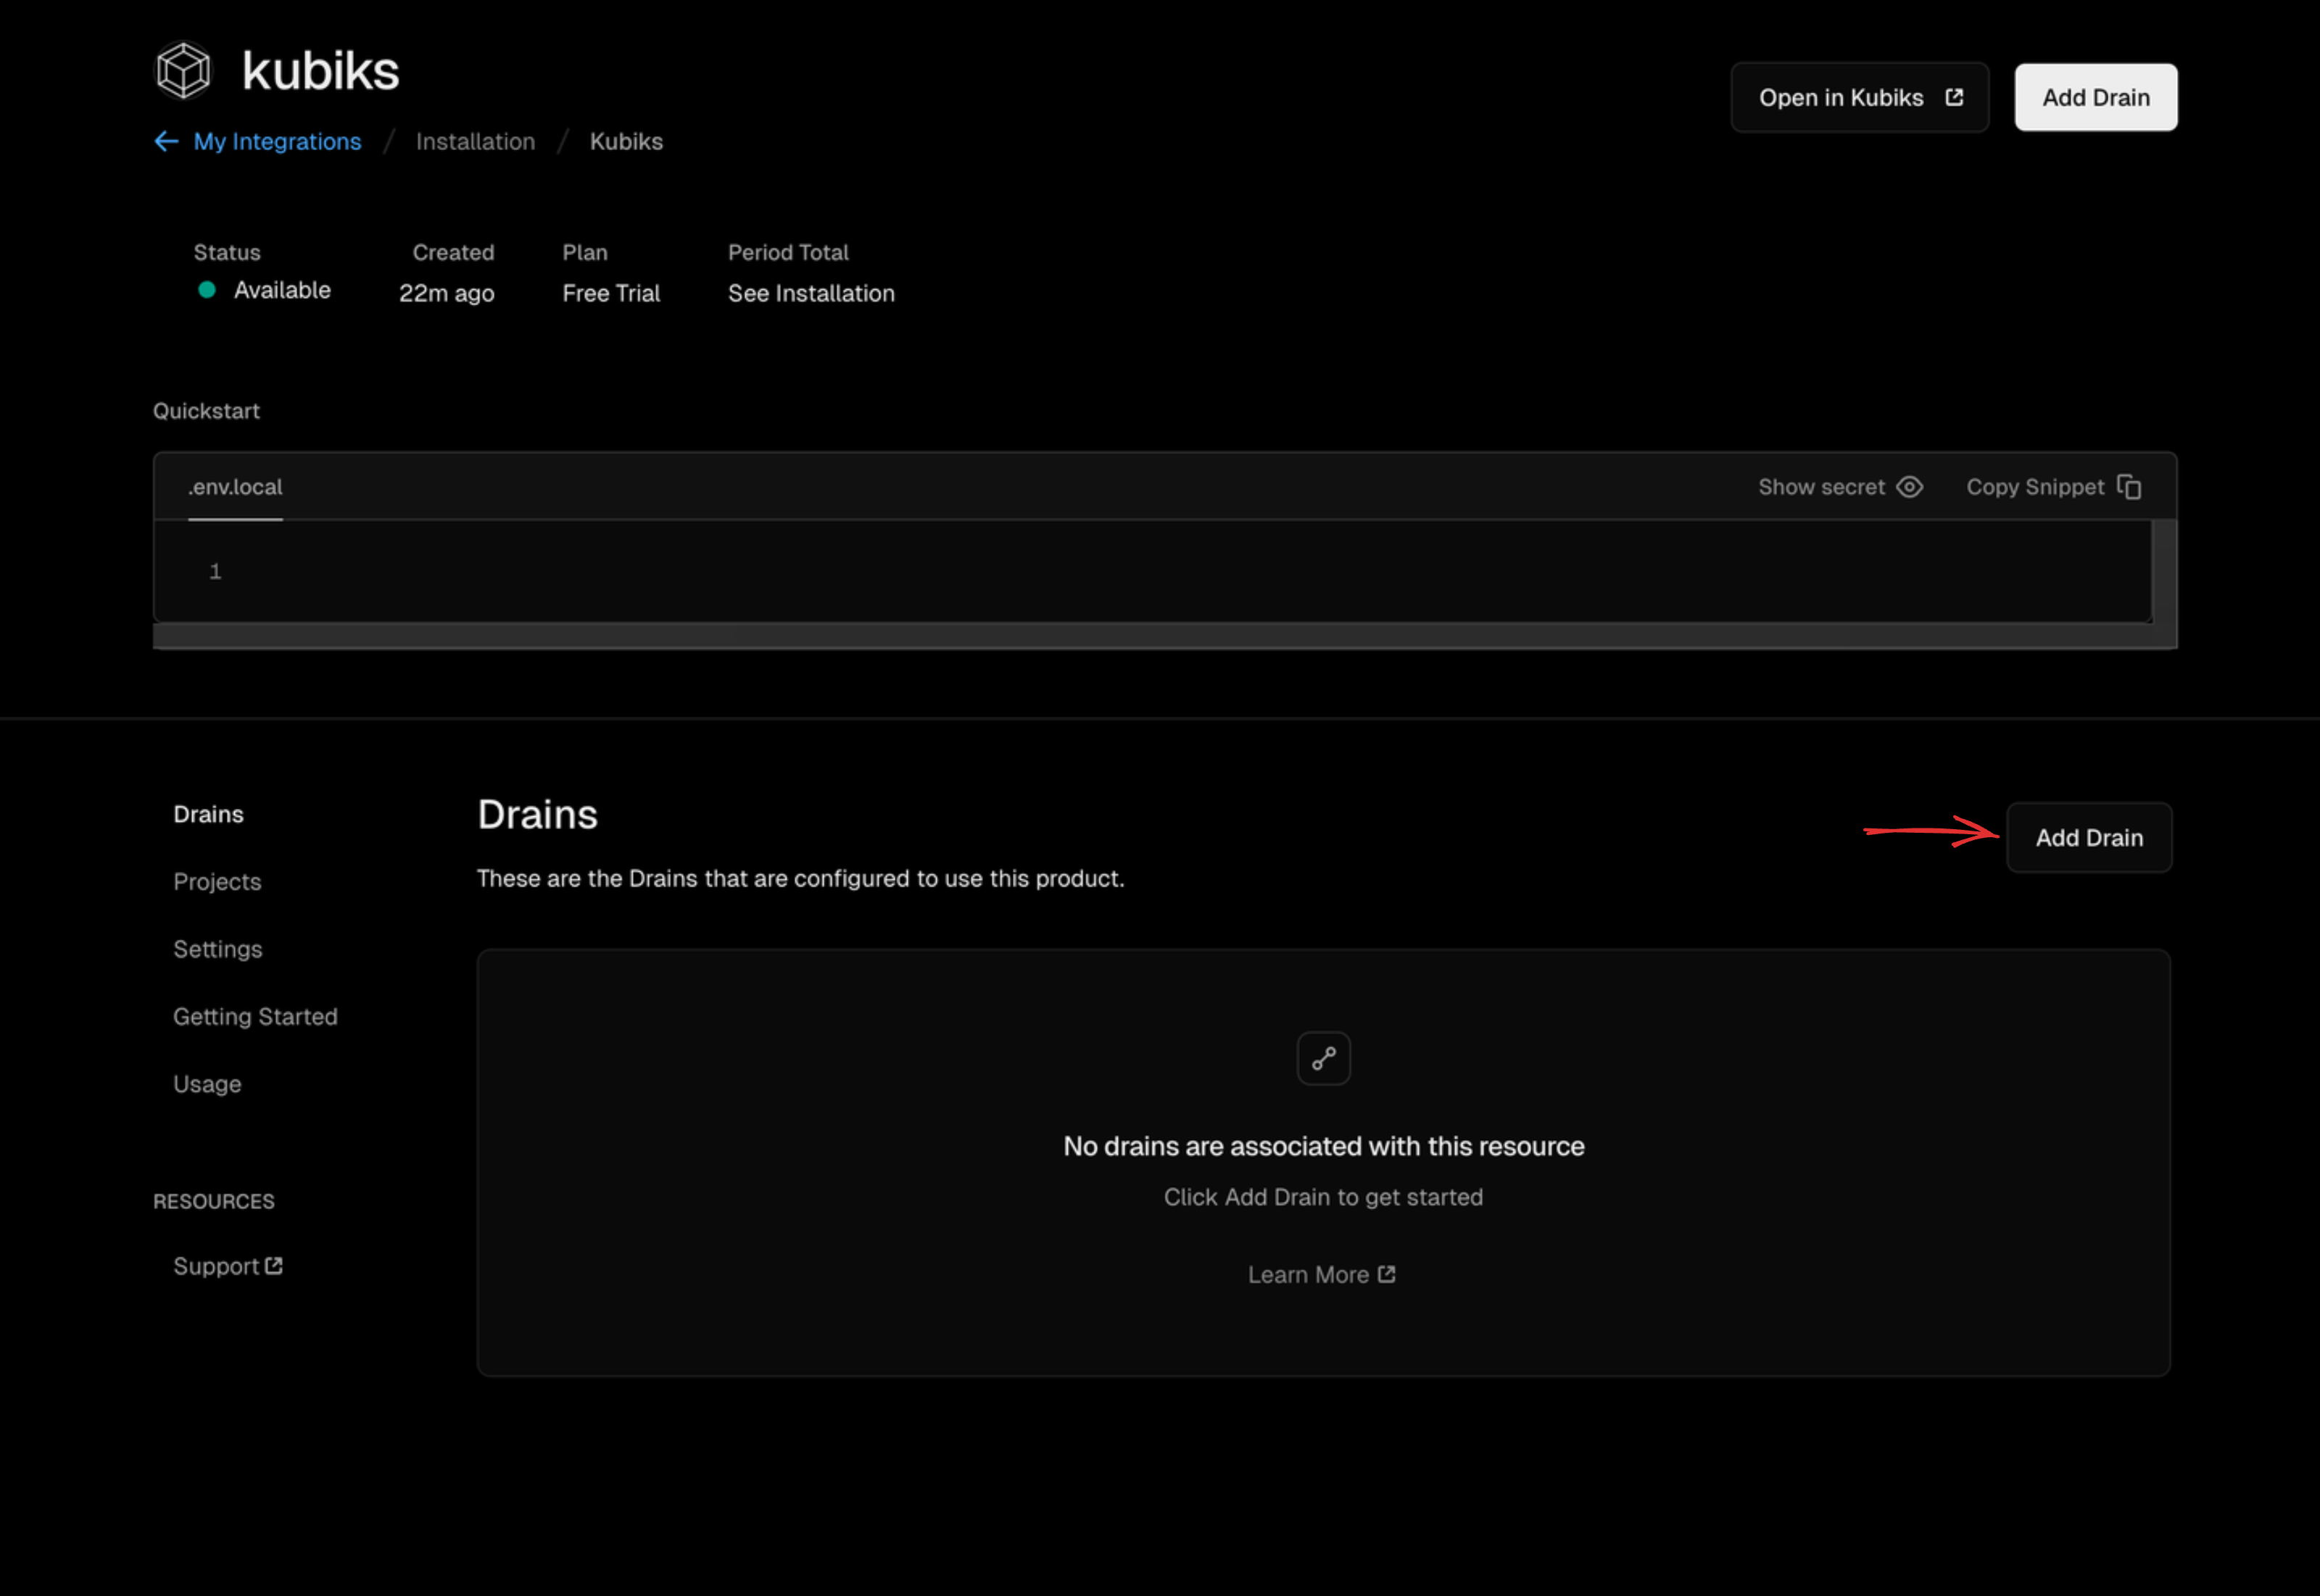
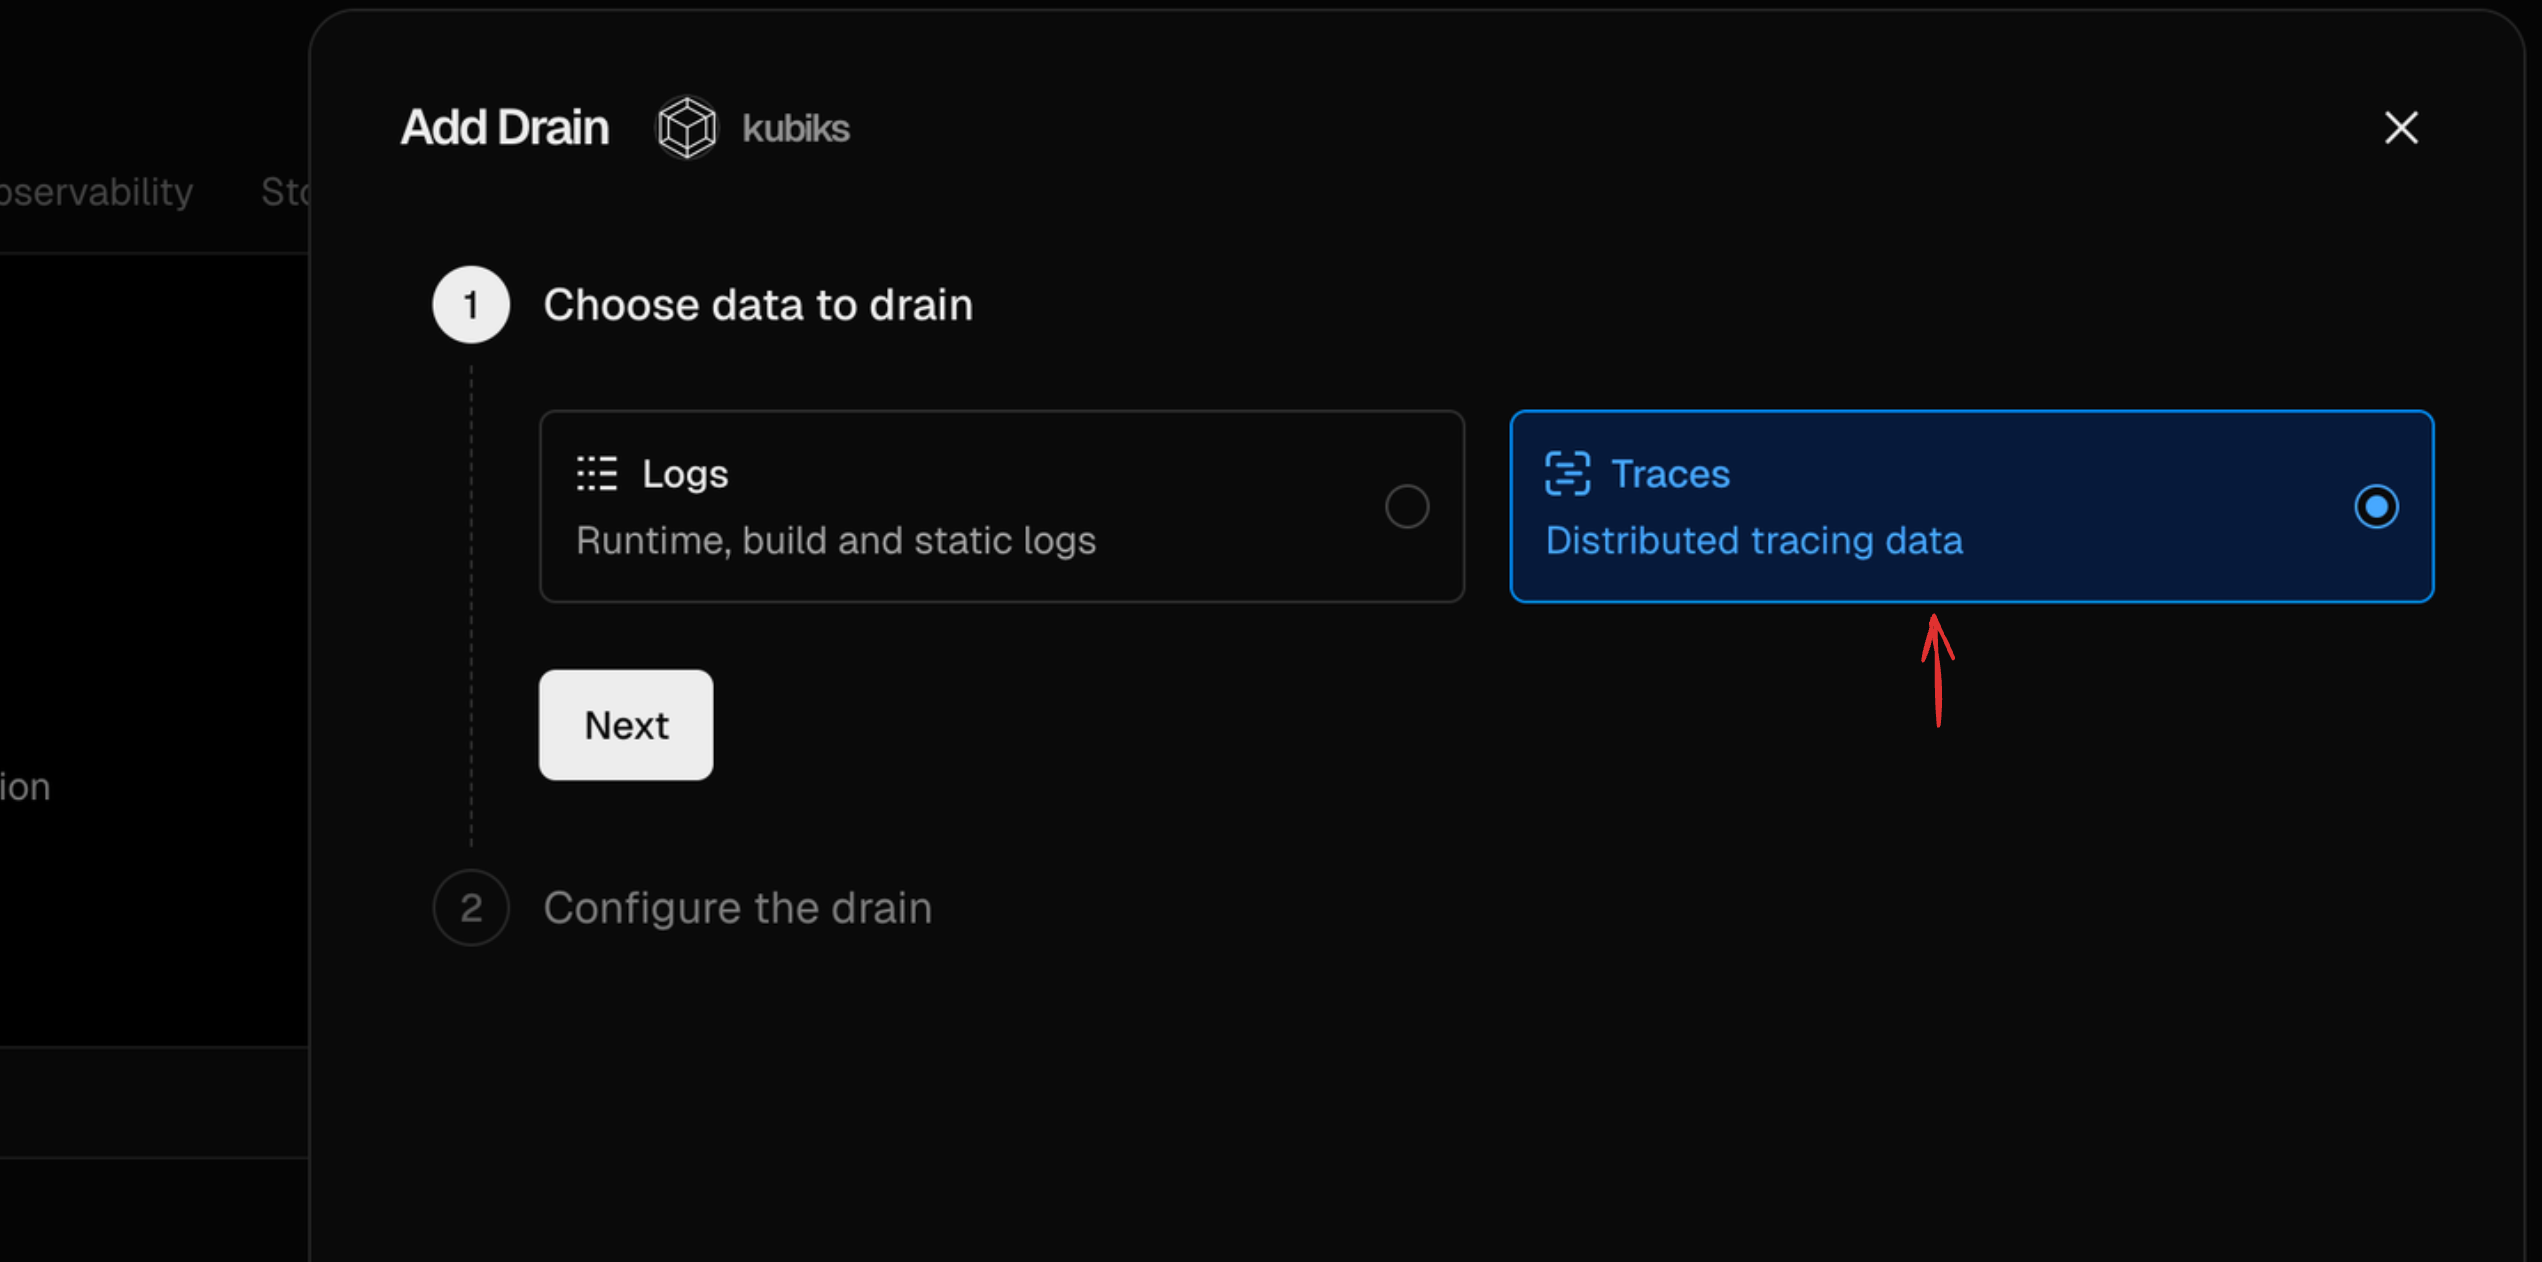
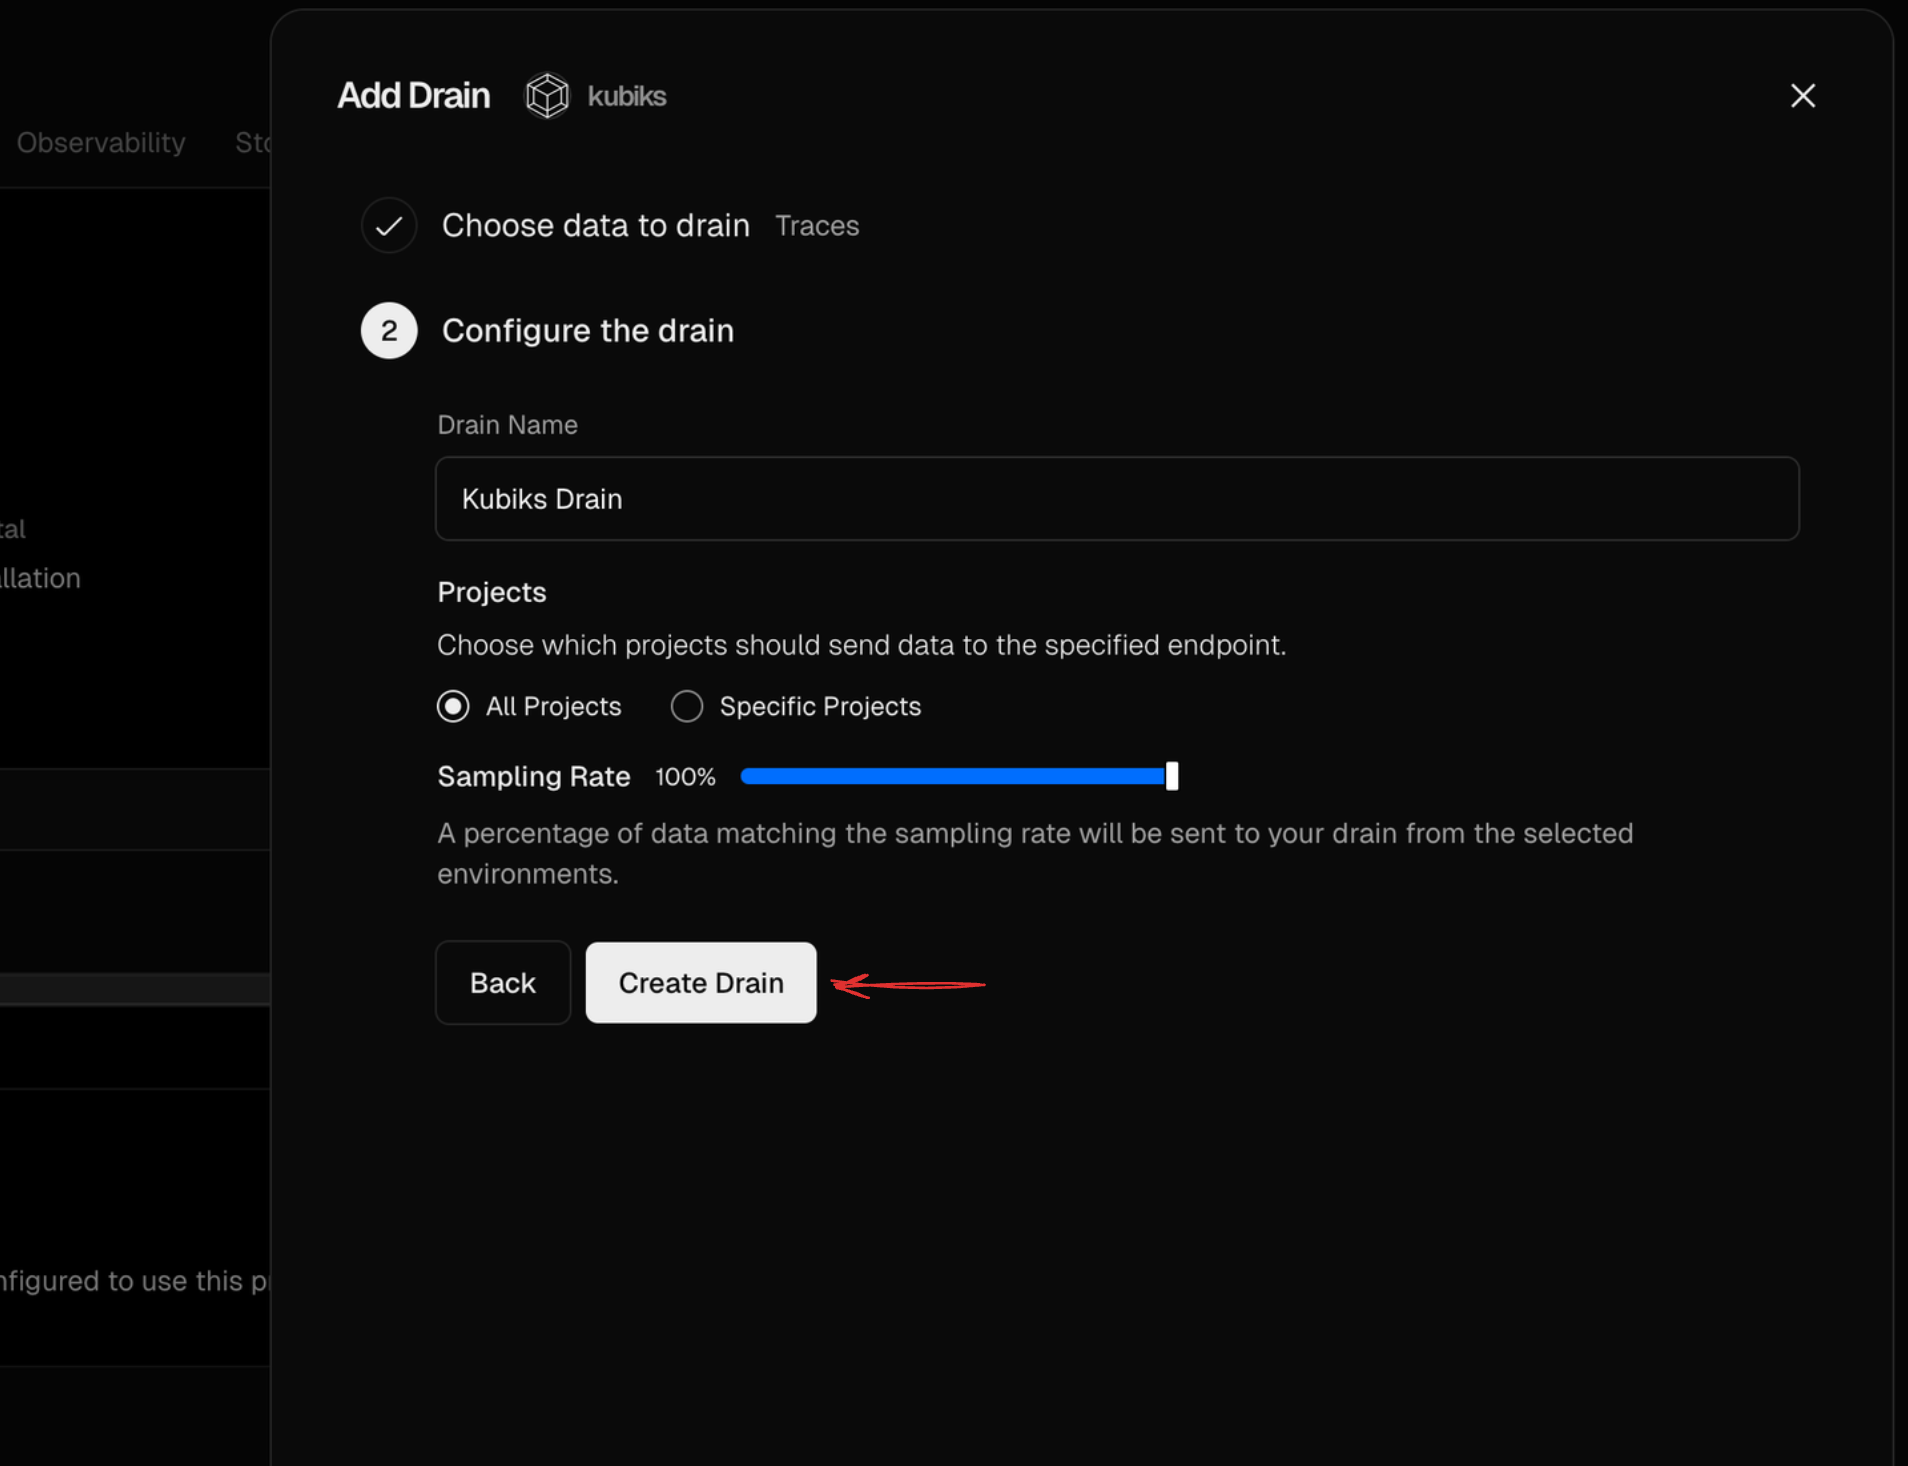
2. Enable Trace Drains
Trace Drains send spans from your Vercel project to Kubiks, providing full request-level tracing and visibility.
3. Install OpenTelemetry SDK
Install the required OpenTelemetry packages:4. Configure Instrumentation
Create aninstrumentation.ts file in your project root:
instrumentation.ts
@vercel/otel package automatically:
- Instruments HTTP requests, fetch calls, and Next.js internals
- Sends traces to Kubiks
Instrument Your Dependencies
Enhance your observability by adding our OpenTelemetry SDKs for popular frameworks and services:Drizzle ORM
Trace all database queries and transactions
Better Auth
Monitor authentication flows and sessions
Resend
Track email delivery and operations
Upstash QStash
Monitor message queue operations
Autumn Billing
Trace billing and payment flows
View All Integrations
Explore all available SDKs
Troubleshooting
No traces appearing in dashboard
No traces appearing in dashboard
Verify that Trace Drains are enabled in your Vercel project settings.Navigate to Settings → Integrations → OpenTelemetry and confirm the Kubiks endpoint is configured.
Logs not appearing
Logs not appearing
Log drains are required for Kubiks to work properly.
- Navigate to Vercel Settings → Log Drains
- Verify the Kubiks endpoint is listed and active
- If missing, reinstall the Kubiks integration
- Check the log drain status indicator (should be green/active)
Resources
Kubiks Dashboard
View your application traces and metrics
Vercel Marketplace
Install the Kubiks integration