
Overview

@kubiks/otel-clickhouse provides comprehensive OpenTelemetry instrumentation for ClickHouse. Add distributed tracing to your ClickHouse database queries with a single line of code—perfect for analytics workloads and OLAP queries.
ClickHouse Trace Visualization
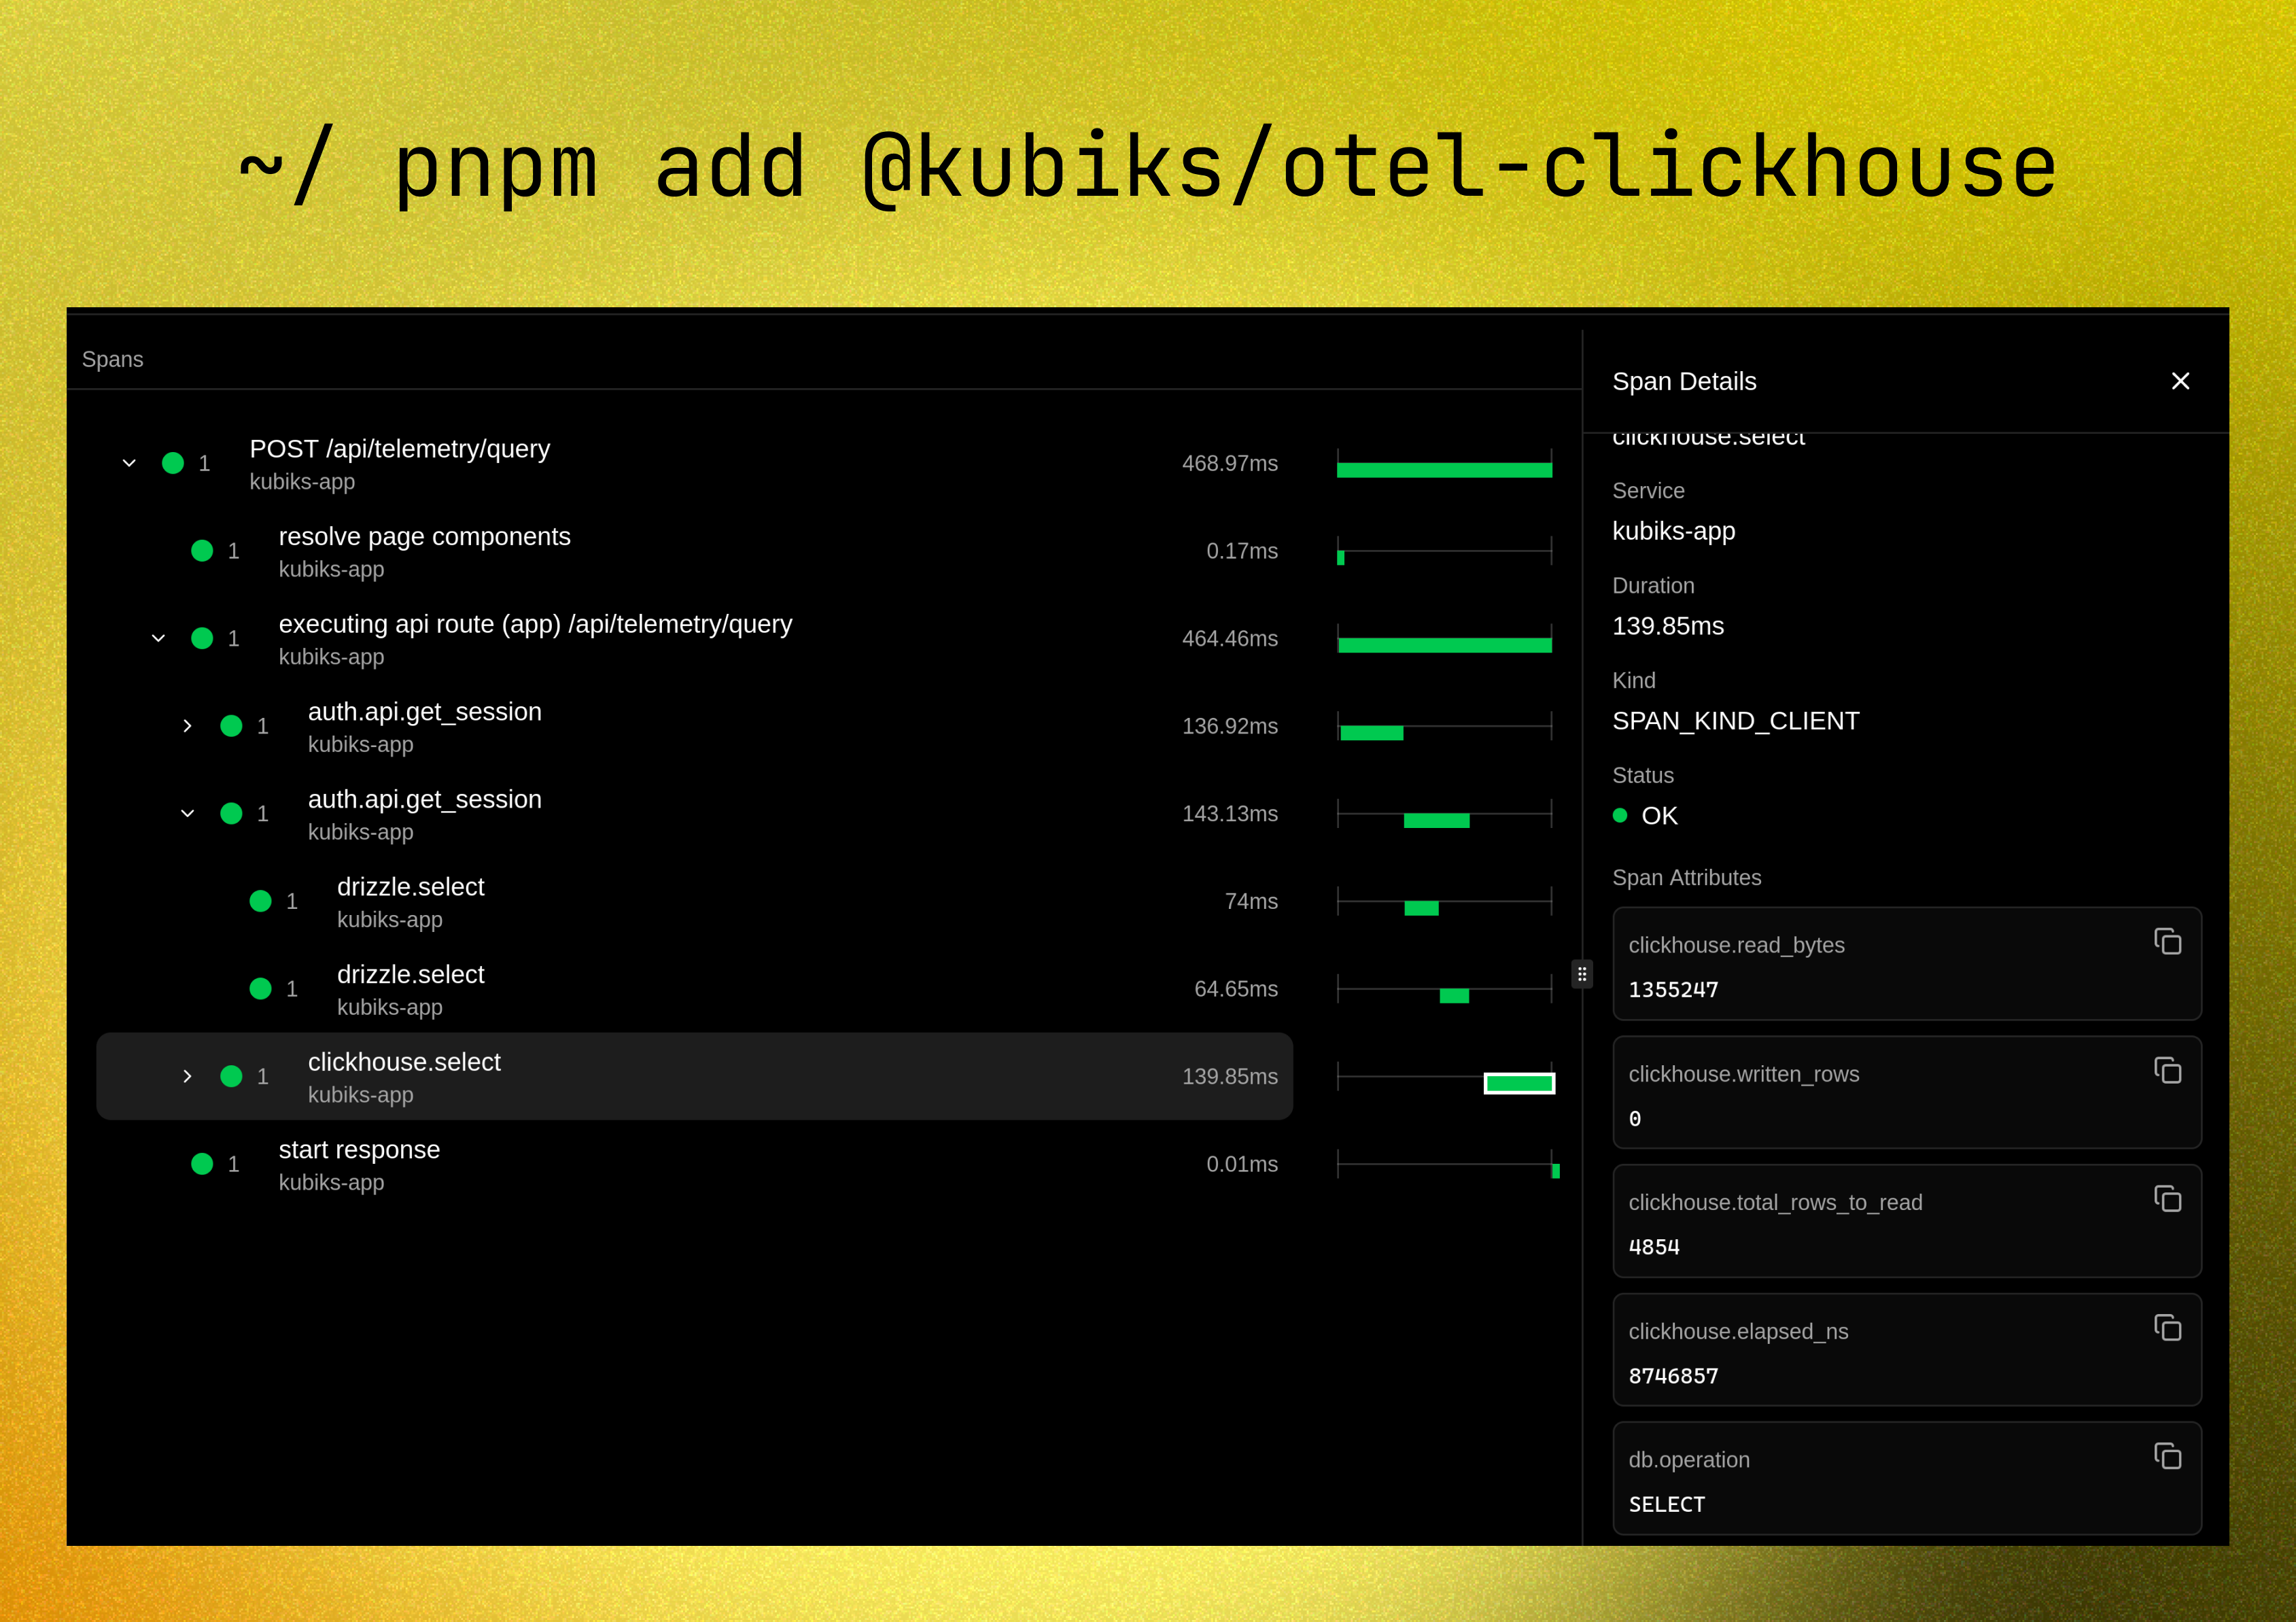
Visualize your ClickHouse queries with detailed span information including query text, execution time, and performance metrics.

Installation

npm install @kubiks/otel-clickhouse
Peer Dependencies: @opentelemetry/api >= 1.9.0, @clickhouse/client >= 0.2.0

Supported Frameworks

Works with any TypeScript framework and Node.js runtime:

Next.js

App Router & Pages Router

Fastify

High-performance server

NestJS

Enterprise framework

Express

Classic Node.js server

Remix

Full-stack framework

SvelteKit

Modern web framework

Supported Platforms

Works with any observability platform that supports OpenTelemetry:

Quick Start

Use ClickHouseInstrumentation to add tracing to your ClickHouse client:
import { createClient } from '@clickhouse/client';
import { ClickHouseInstrumentation } from '@kubiks/otel-clickhouse';
import { registerOTel } from '@vercel/otel';

// Register OpenTelemetry with ClickHouse instrumentation
export function register() {
  registerOTel({
    serviceName: 'your-app',
    instrumentations: [
      new ClickHouseInstrumentation(),
    ],
  });
}

// Create your ClickHouse client as usual
const client = createClient({
  host: process.env.CLICKHOUSE_HOST,
  username: process.env.CLICKHOUSE_USER,
  password: process.env.CLICKHOUSE_PASSWORD,
  database: process.env.CLICKHOUSE_DB,
});

// All queries are now automatically traced
const result = await client.query({
  query: 'SELECT * FROM events WHERE timestamp > now() - INTERVAL 1 HOUR',
});
This is the simplest approach—just add the instrumentation and all ClickHouse queries are automatically traced!

Configuration Options

new ClickHouseInstrumentation({
  captureQueryText: true,       // Include SQL in traces (default: true)
  maxQueryTextLength: 1000,     // Max SQL length (default: 1000)
  captureParameters: false,     // Include query parameters (default: false)
})
By default, SQL queries are captured in spans. You can disable this by setting captureQueryText: false for sensitive environments.

What You Get

Each ClickHouse query automatically creates a span with rich telemetry data:
  • Span name: clickhouse.query, clickhouse.insert, etc.
  • Operation type: db.operation attribute (SELECT, INSERT, CREATE TABLE, etc.)
  • SQL query text: Full query statement captured in db.statement (configurable)
  • Database system: db.system attribute (clickhouse)
  • Database name: db.name attribute
  • Server address: server.address and server.port attributes
  • Query execution time
  • Number of rows read
  • Number of bytes processed
  • Network latency
  • Exceptions are recorded with stack traces
  • Proper span status (OK, ERROR)
  • Error messages and ClickHouse error codes

Span Attributes

The instrumentation adds the following attributes to each span following OpenTelemetry semantic conventions:
AttributeDescriptionExample
db.operationSQL operation typeSELECT
db.statementFull SQL querySELECT * FROM events...
db.systemDatabase systemclickhouse
db.nameDatabase nameanalytics
server.addressServer hostnameclickhouse.example.com
server.portServer port8123

Usage Examples

Basic Queries

import { createClient } from '@clickhouse/client';

const client = createClient({
  host: process.env.CLICKHOUSE_HOST,
});

// Traced as: clickhouse.query
const result = await client.query({
  query: 'SELECT count(*) FROM events WHERE date = today()',
  format: 'JSONEachRow',
});

const data = await result.json();

Streaming Queries

import { createClient } from '@clickhouse/client';

const client = createClient({
  host: process.env.CLICKHOUSE_HOST,
});

// Stream large result sets - traced from start to finish
const stream = await client.query({
  query: 'SELECT * FROM large_table',
  format: 'JSONEachRow',
});

const reader = stream.stream();
for await (const rows of reader) {
  // Process rows in chunks
  console.log(rows);
}

Parameterized Queries

import { createClient } from '@clickhouse/client';

const client = createClient({
  host: process.env.CLICKHOUSE_HOST,
});

// Use query parameters for safety
const result = await client.query({
  query: 'SELECT * FROM events WHERE user_id = {userId:UInt64} AND date >= {startDate:Date}',
  query_params: {
    userId: 12345,
    startDate: '2024-01-01',
  },
  format: 'JSONEachRow',
});

Complete Integration Example

Here’s a complete example of ClickHouse with OpenTelemetry in a Next.js application:
lib/clickhouse.ts
import { createClient } from '@clickhouse/client';

export const clickhouse = createClient({
  host: process.env.CLICKHOUSE_HOST,
  username: process.env.CLICKHOUSE_USER,
  password: process.env.CLICKHOUSE_PASSWORD,
  database: process.env.CLICKHOUSE_DB,
});
instrumentation.ts
import { registerOTel } from '@vercel/otel';
import { ClickHouseInstrumentation } from '@kubiks/otel-clickhouse';

export function register() {
  registerOTel({
    serviceName: 'your-app',
    instrumentations: [
      new ClickHouseInstrumentation({
        captureQueryText: true,
        maxQueryTextLength: 2000,
      }),
    ],
  });
}
app/api/analytics/route.ts
import { NextRequest, NextResponse } from 'next/server';
import { clickhouse } from '@/lib/clickhouse';

export async function GET(request: NextRequest) {
  const { searchParams } = new URL(request.url);
  const days = searchParams.get('days') || '7';

  // Automatically traced
  const result = await clickhouse.query({
    query: `
      SELECT 
        toDate(timestamp) as date,
        count(*) as events
      FROM analytics_events
      WHERE timestamp >= now() - INTERVAL {days:UInt32} DAY
      GROUP BY date
      ORDER BY date
    `,
    query_params: { days: parseInt(days) },
    format: 'JSONEachRow',
  });

  const data = await result.json();
  return NextResponse.json(data);
}

Best Practices

ClickHouse client handles connection pooling automatically:
const client = createClient({
  host: process.env.CLICKHOUSE_HOST,
  max_open_connections: 10,
});
Set appropriate timeouts for your queries:
const result = await client.query({
  query: 'SELECT * FROM large_table',
  query_params: {
    max_execution_time: 30, // seconds
  },
});
For high-throughput scenarios, batch your inserts:
await client.insert({
  table: 'events',
  values: largeArrayOfEvents, // Insert in batches
  format: 'JSONEachRow',
});
Use traces to identify slow queries and optimize them with appropriate indexes and table engines.

Performance Considerations

The instrumentation adds minimal overhead (~1-2ms per query) for tracing operations.
Use OpenTelemetry sampling to reduce data volume in high-traffic applications:
import { TraceIdRatioBasedSampler } from '@opentelemetry/sdk-trace-base';

registerOTel({
  serviceName: 'your-app',
  sampler: new TraceIdRatioBasedSampler(0.1), // Sample 10% of traces
});

Troubleshooting

Ensure OpenTelemetry is initialized before making ClickHouse queries:
// In instrumentation.ts or instrumentation.node.ts
export function register() {
  registerOTel({
    serviceName: 'your-app',
    instrumentations: [new ClickHouseInstrumentation()],
  });
}
Check that captureQueryText is enabled:
new ClickHouseInstrumentation({
  captureQueryText: true,
  maxQueryTextLength: 2000,
})
Verify your ClickHouse connection settings:
const client = createClient({
  host: process.env.CLICKHOUSE_HOST,
  username: process.env.CLICKHOUSE_USER,
  password: process.env.CLICKHOUSE_PASSWORD,
  // Test the connection
});

await client.ping(); // Should return true

Resources

License

MIT