
Overview

@kubiks/otel-inbound provides comprehensive OpenTelemetry instrumentation for inbound HTTP requests. Automatically trace all incoming requests to your application with detailed metadata about request/response cycles, headers, status codes, and performance metrics.
Inbound Request Trace Visualization
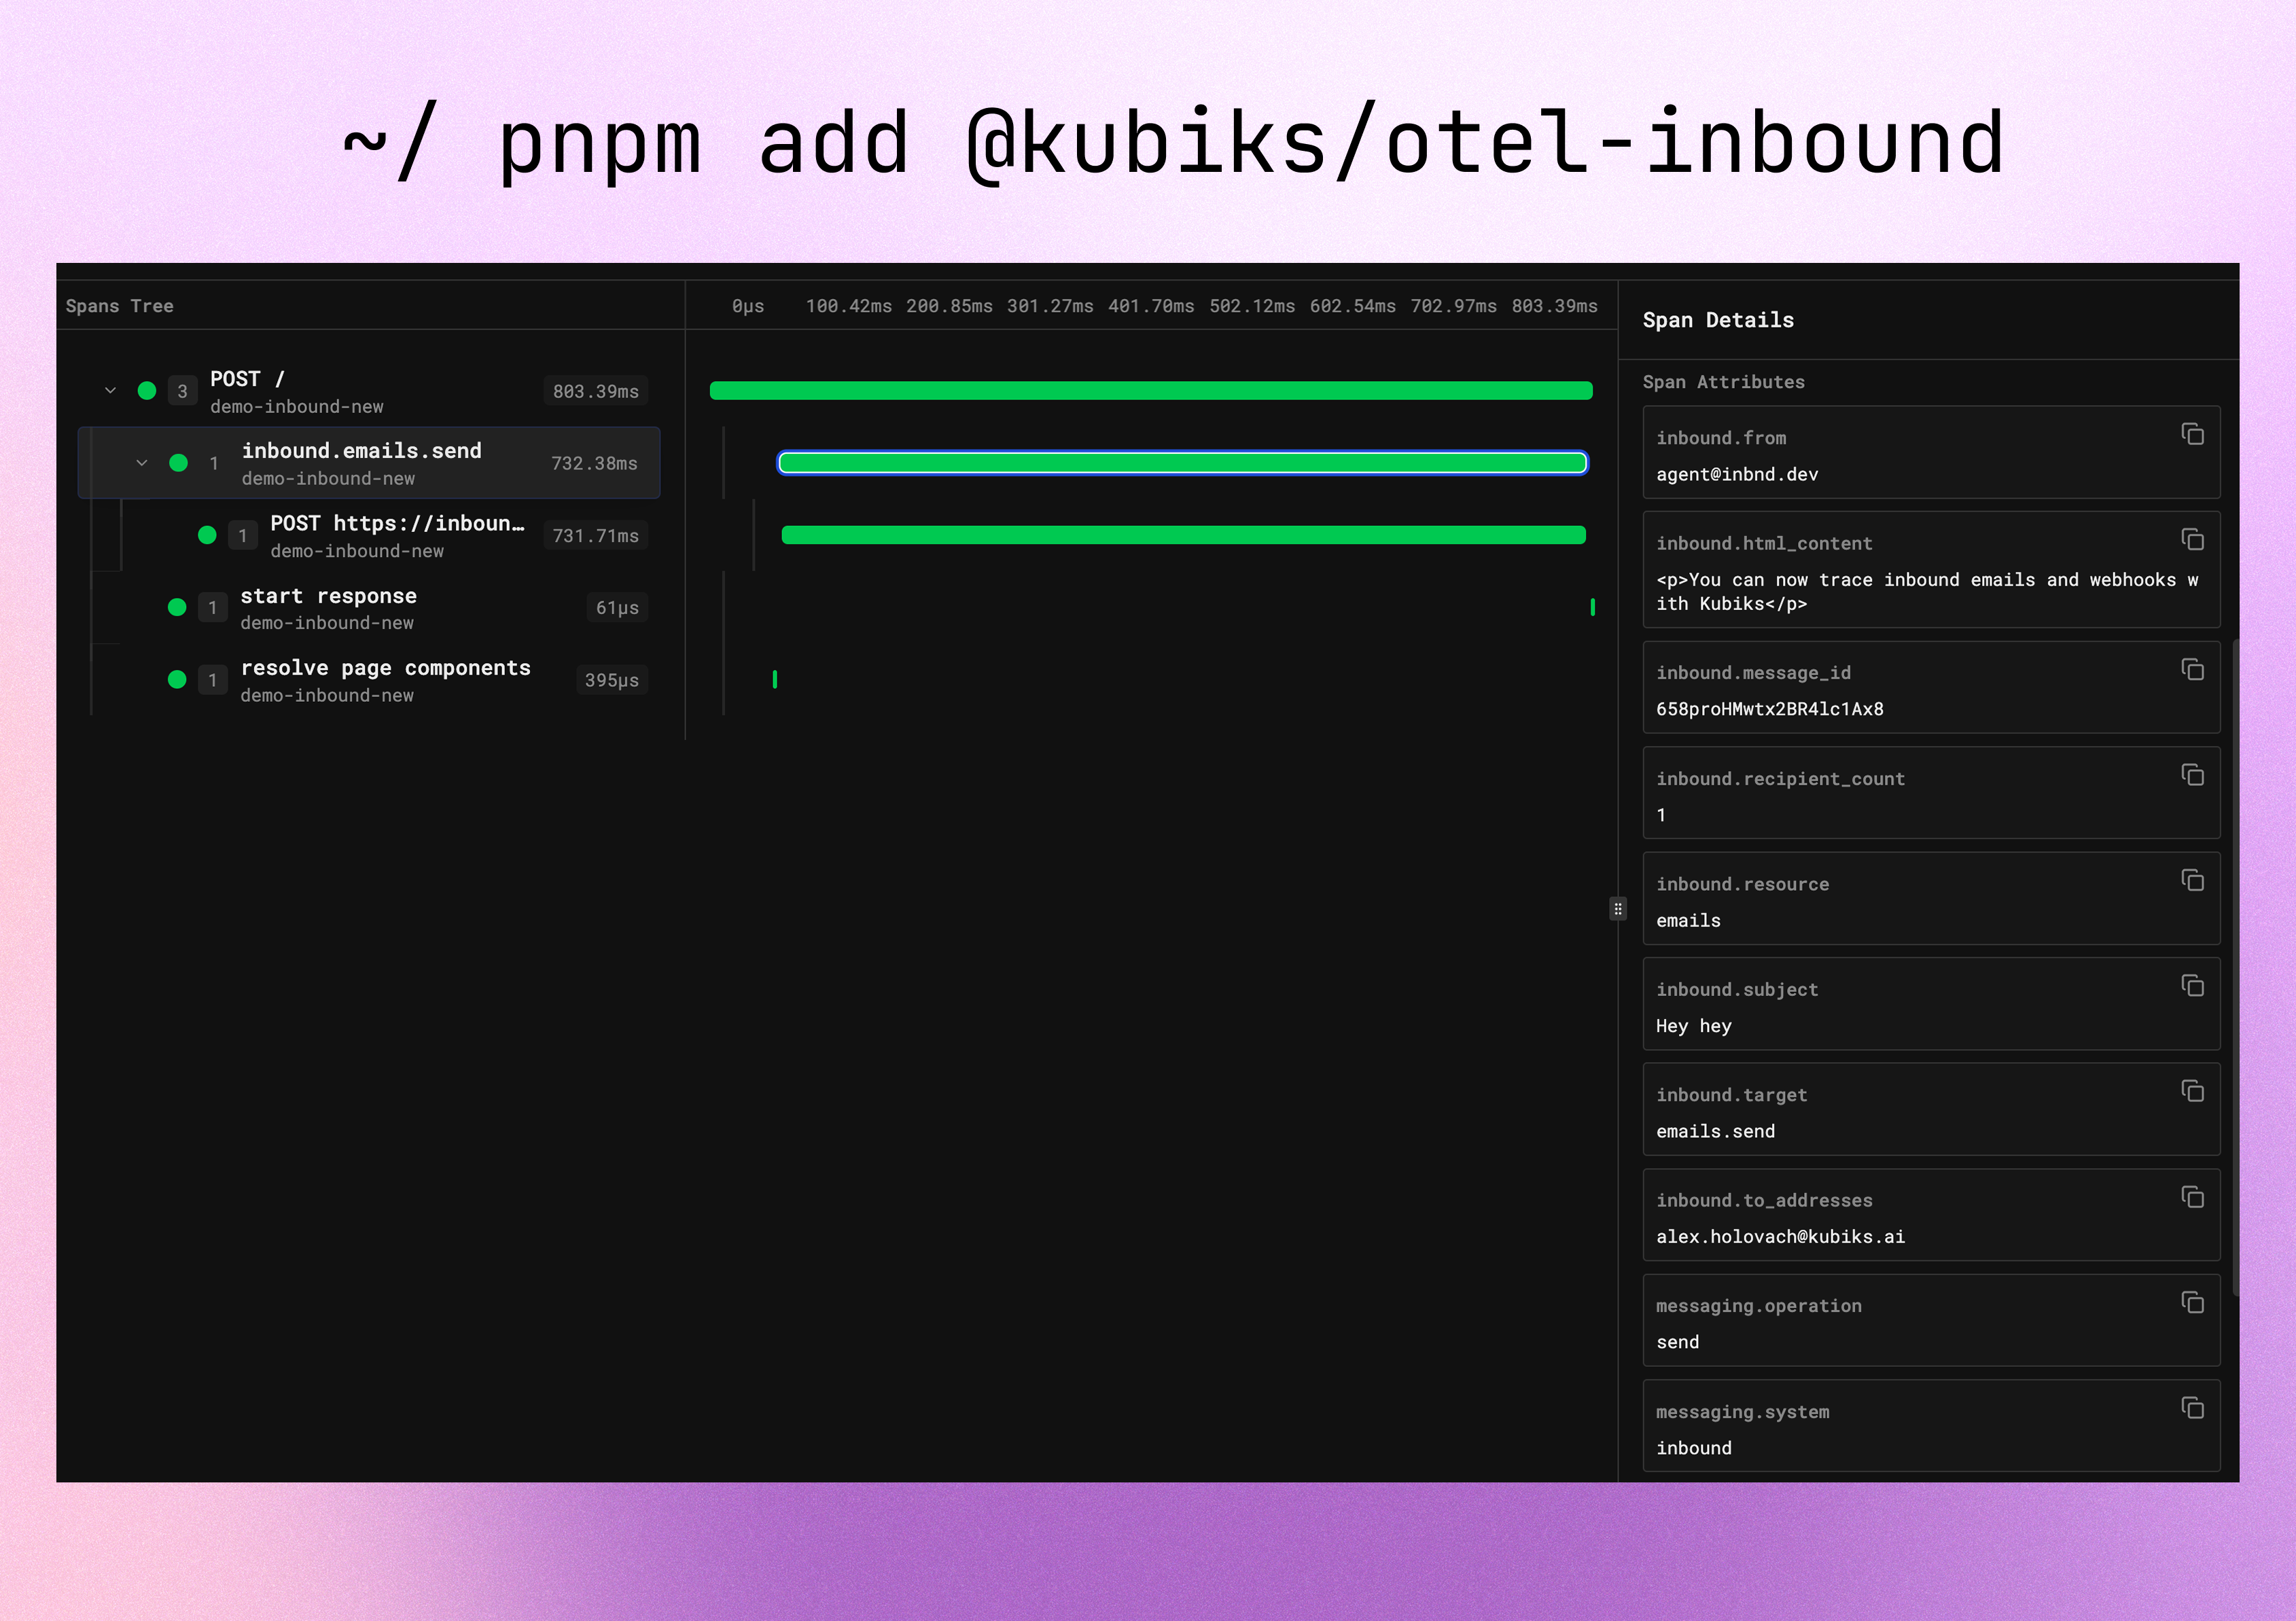
Visualize every inbound HTTP request with detailed span information including URL, method, headers, response status, and timing.

Installation

npm install @kubiks/otel-inbound
Peer Dependencies: @opentelemetry/api >= 1.9.0

Supported Frameworks

Works with any TypeScript framework and Node.js runtime:

Next.js

App Router & Pages Router

Fastify

High-performance server

NestJS

Enterprise framework

Express

Classic Node.js server

Remix

Full-stack framework

SvelteKit

Modern web framework

Supported Platforms

Works with any observability platform that supports OpenTelemetry:

Quick Start

Use InboundInstrumentation to automatically trace all incoming HTTP requests:
import { InboundInstrumentation } from '@kubiks/otel-inbound';
import { registerOTel } from '@vercel/otel';

// Register OpenTelemetry with Inbound instrumentation
export function register() {
  registerOTel({
    serviceName: 'your-app',
    instrumentations: [
      new InboundInstrumentation(),
    ],
  });
}

// That's it! All inbound HTTP requests are now automatically traced
This is zero-config—just add the instrumentation and all inbound requests are automatically traced with no code changes required!

Configuration Options

new InboundInstrumentation({
  captureHeaders: true,           // Capture request/response headers (default: true)
  captureBody: false,            // Capture request/response body (default: false)
  maxBodyLength: 1000,           // Max body length to capture (default: 1000)
  ignorePaths: ['/health'],      // Paths to ignore (default: [])
  ignoreUserAgents: [],          // User agents to ignore (default: [])
  captureQueryString: true,      // Include query strings (default: true)
})
By default, headers and query strings are captured but not request/response bodies. Enable captureBody carefully as it can expose sensitive data.

What You Get

Each inbound HTTP request automatically creates a span with rich telemetry data:
  • Span name: HTTP method + route (e.g., GET /api/users)
  • HTTP method: GET, POST, PUT, DELETE, etc.
  • URL: Full request URL including query parameters
  • Route: Matched route pattern
  • Status code: Response status code (200, 404, 500, etc.)
  • Duration: Total request/response time
  • Request headers (configurable)
  • Query parameters
  • Request body (optional)
  • User agent
  • Client IP address
  • Content type and length
  • Response status code
  • Response headers (configurable)
  • Response body (optional)
  • Content type and length
  • Total request duration
  • Time to first byte
  • Response size
  • Exceptions are recorded with stack traces
  • Proper span status (OK, ERROR)
  • Error messages and HTTP status codes
  • Failed request details

Span Attributes

The instrumentation adds the following attributes to each span following OpenTelemetry semantic conventions:
AttributeDescriptionExample
http.methodHTTP methodGET
http.urlFull URLhttps://api.example.com/users?page=1
http.routeRoute pattern/api/users
http.status_codeResponse status200
http.user_agentClient user agentMozilla/5.0...
http.client_ipClient IP192.168.1.1
http.request_content_lengthRequest size (bytes)1024
http.response_content_lengthResponse size (bytes)2048

Usage Examples

Basic HTTP Tracing

Next.js App Router
// app/api/users/route.ts
import { NextRequest, NextResponse } from 'next/server';

// All requests are automatically traced
export async function GET(request: NextRequest) {
  const users = await fetchUsers();
  return NextResponse.json(users);
}

export async function POST(request: NextRequest) {
  const body = await request.json();
  const user = await createUser(body);
  return NextResponse.json(user, { status: 201 });
}
Next.js Pages Router
// pages/api/users.ts
import type { NextApiRequest, NextApiResponse } from 'next';

// All requests are automatically traced
export default async function handler(
  req: NextApiRequest,
  res: NextApiResponse
) {
  if (req.method === 'GET') {
    const users = await fetchUsers();
    return res.status(200).json(users);
  }
  
  if (req.method === 'POST') {
    const user = await createUser(req.body);
    return res.status(201).json(user);
  }
  
  return res.status(405).json({ error: 'Method not allowed' });
}

Custom Configuration

import { InboundInstrumentation } from '@kubiks/otel-inbound';
import { registerOTel } from '@vercel/otel';

export function register() {
  registerOTel({
    serviceName: 'your-app',
    instrumentations: [
      new InboundInstrumentation({
        // Capture headers except sensitive ones
        captureHeaders: true,
        
        // Don't trace health checks
        ignorePaths: ['/health', '/ping', '/metrics'],
        
        // Don't trace monitoring bots
        ignoreUserAgents: ['UptimeRobot', 'Pingdom'],
        
        // Capture query strings for analytics
        captureQueryString: true,
        
        // Don't capture request bodies (may contain sensitive data)
        captureBody: false,
      }),
    ],
  });
}

Error Handling

// app/api/error-test/route.ts
import { NextRequest, NextResponse } from 'next/server';

export async function GET(request: NextRequest) {
  try {
    // This error will be captured in the trace
    throw new Error('Something went wrong');
  } catch (error) {
    // Error details are automatically added to the span
    return NextResponse.json(
      { error: 'Internal server error' },
      { status: 500 }
    );
  }
}

Complete Integration Example

Here’s a complete example with Inbound instrumentation in a Next.js application:
instrumentation.ts
import { registerOTel } from '@vercel/otel';
import { InboundInstrumentation } from '@kubiks/otel-inbound';

export function register() {
  registerOTel({
    serviceName: 'my-next-app',
    instrumentations: [
      new InboundInstrumentation({
        captureHeaders: true,
        ignorePaths: ['/health', '/_next'],
        captureQueryString: true,
      }),
    ],
  });
}
app/api/users/[id]/route.ts
import { NextRequest, NextResponse } from 'next/server';

// GET /api/users/123 - automatically traced
export async function GET(
  request: NextRequest,
  { params }: { params: { id: string } }
) {
  const user = await fetchUser(params.id);
  
  if (!user) {
    return NextResponse.json(
      { error: 'User not found' },
      { status: 404 }
    );
  }
  
  return NextResponse.json(user);
}

// PUT /api/users/123 - automatically traced
export async function PUT(
  request: NextRequest,
  { params }: { params: { id: string } }
) {
  const body = await request.json();
  const user = await updateUser(params.id, body);
  
  return NextResponse.json(user);
}

// DELETE /api/users/123 - automatically traced
export async function DELETE(
  request: NextRequest,
  { params }: { params: { id: string } }
) {
  await deleteUser(params.id);
  
  return NextResponse.json({ success: true });
}

Best Practices

Be careful with capturing headers and bodies:
new InboundInstrumentation({
  captureHeaders: true,
  captureBody: false, // Bodies may contain sensitive data
  // Filter sensitive headers in your collector/exporter
})
Exclude monitoring endpoints to reduce noise:
new InboundInstrumentation({
  ignorePaths: [
    '/health',
    '/ping',
    '/metrics',
    '/_next/static',
  ],
})
Use traces to identify slow endpoints and optimize them:
  • Look for high-duration spans
  • Identify N+1 query problems
  • Optimize database queries
  • Add caching where appropriate
Configure alerts for high error rates or slow responses based on span data.

Performance Considerations

The instrumentation adds minimal overhead (~1ms per request) for tracing operations.
Use sampling for high-traffic applications:
import { TraceIdRatioBasedSampler } from '@opentelemetry/sdk-trace-base';

registerOTel({
  serviceName: 'your-app',
  sampler: new TraceIdRatioBasedSampler(0.1), // Sample 10% of traces
});
Don’t trace static assets to reduce volume:
new InboundInstrumentation({
  ignorePaths: [
    '/_next/static',
    '/static',
    '/favicon.ico',
    '/*.png',
  ],
})

Troubleshooting

Ensure OpenTelemetry is initialized before the server starts:
// In instrumentation.ts or instrumentation.node.ts
export function register() {
  registerOTel({
    serviceName: 'your-app',
    instrumentations: [new InboundInstrumentation()],
  });
}
Check that captureHeaders is enabled:
new InboundInstrumentation({
  captureHeaders: true,
})
Check if they’re in the ignore list:
new InboundInstrumentation({
  ignorePaths: ['/health'], // These paths won't be traced
})
Consider sampling or ignoring more paths:
new InboundInstrumentation({
  ignorePaths: [
    '/health',
    '/_next',
    '/static',
  ],
})

Resources

License

MIT