
Overview

@kubiks/otel-e2b provides comprehensive OpenTelemetry instrumentation for E2B (Code Interpreter). Add distributed tracing to your AI-powered code execution, sandbox operations, and code interpreter workflows with automatic instrumentation.
E2B Trace Visualization
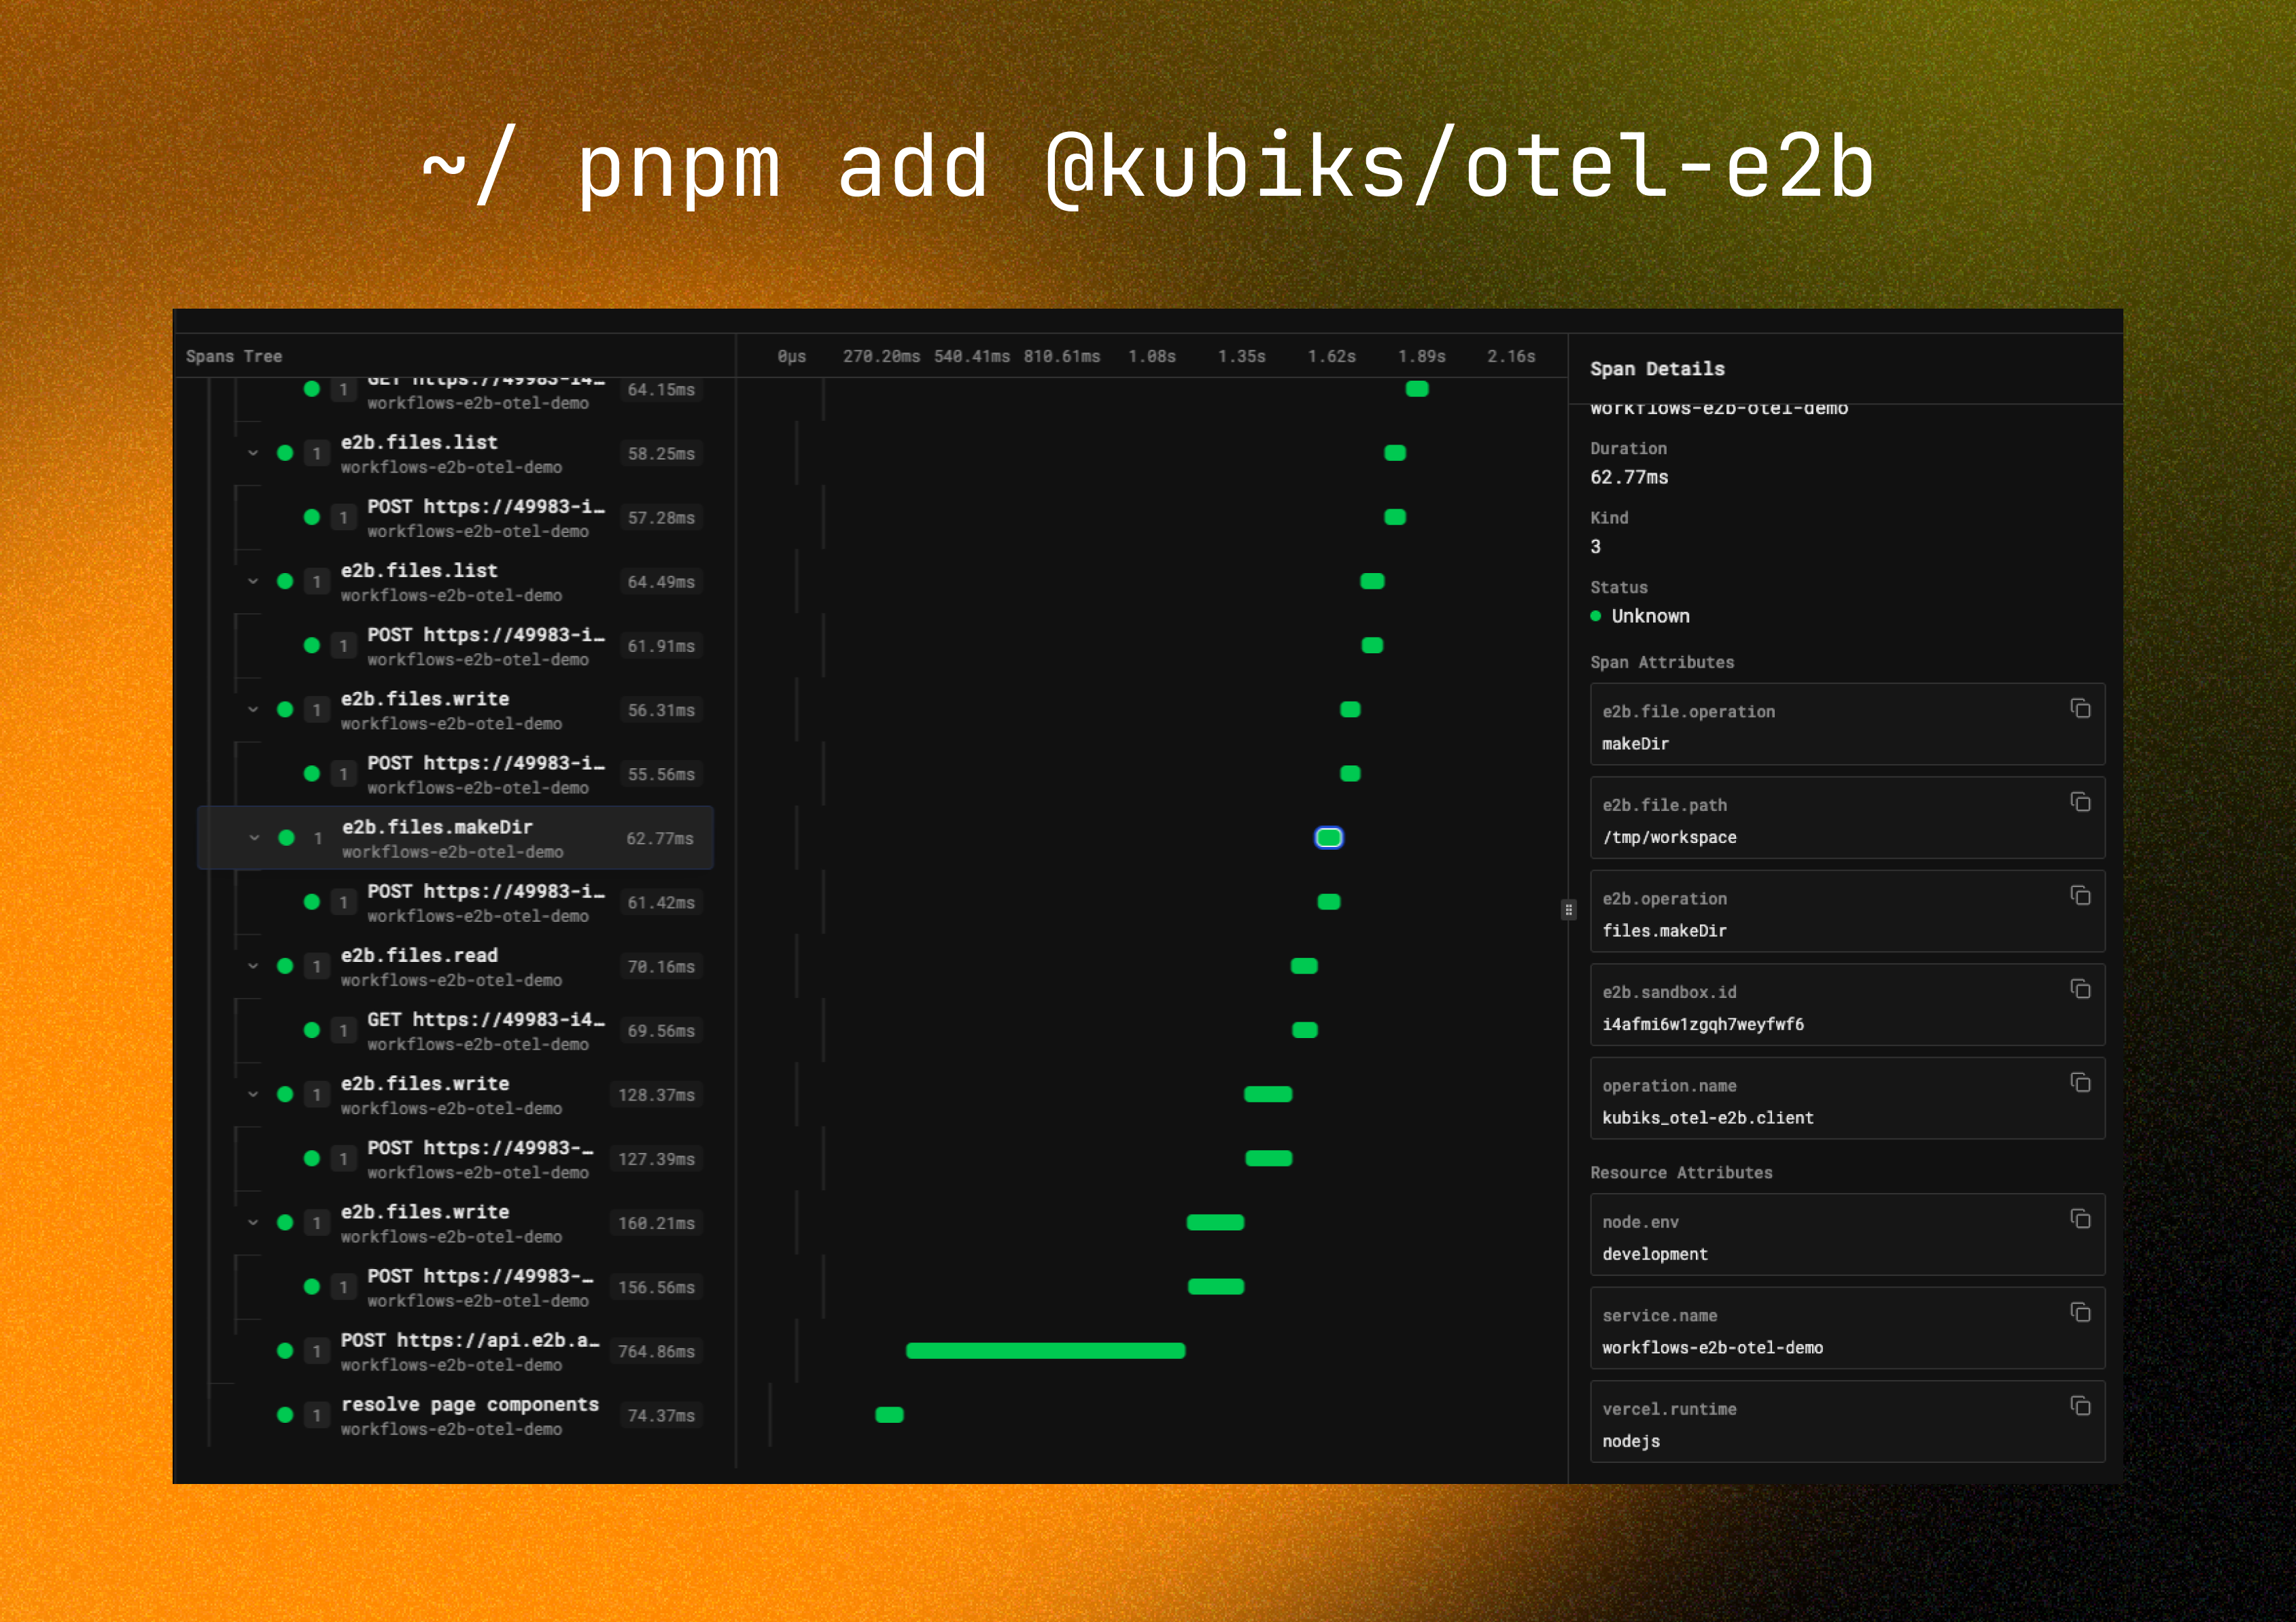
Visualize your E2B operations with detailed span information including code execution, sandbox lifecycle, and performance metrics.

Installation

npm install @kubiks/otel-e2b
Peer Dependencies: @opentelemetry/api >= 1.9.0, @e2b/code-interpreter >= 0.1.0

Supported Frameworks

Works with any TypeScript framework and Node.js runtime:

Next.js

App Router & Pages Router

Fastify

High-performance server

NestJS

Enterprise framework

Express

Classic Node.js server

Remix

Full-stack framework

SvelteKit

Modern web framework

Supported Platforms

Works with any observability platform that supports OpenTelemetry:

Quick Start

Use E2BInstrumentation to add tracing to your E2B code interpreter:
import { CodeInterpreter } from '@e2b/code-interpreter';
import { E2BInstrumentation } from '@kubiks/otel-e2b';
import { registerOTel } from '@vercel/otel';

// Register OpenTelemetry with E2B instrumentation
export function register() {
  registerOTel({
    serviceName: 'your-app',
    instrumentations: [
      new E2BInstrumentation(),
    ],
  });
}

// Create and use code interpreter - all operations are automatically traced
const sandbox = await CodeInterpreter.create({
  apiKey: process.env.E2B_API_KEY,
});

// Execute Python code - fully traced
const execution = await sandbox.notebook.execCell('print("Hello, World!")');
console.log(execution.text);

await sandbox.close();
This is the simplest approach—just add the instrumentation and all E2B operations are automatically traced!

Configuration Options

new E2BInstrumentation({
  captureCodeContent: true,      // Include code in traces (default: true)
  maxCodeLength: 1000,          // Max code length (default: 1000)
  captureOutput: true,          // Include execution output (default: true)
  maxOutputLength: 1000,        // Max output length (default: 1000)
})
By default, code and output are captured in spans. You can disable this by setting the respective options to false for sensitive environments.

What You Get

Each E2B operation automatically creates a span with rich telemetry data:
  • Span name: e2b.sandbox.create, e2b.notebook.execCell, e2b.filesystem.write, etc.
  • Operation type: Type of E2B operation (create, execute, read, write, etc.)
  • Code content: The code being executed (configurable)
  • Execution output: Results from code execution (configurable)
  • Sandbox ID: Unique identifier for the sandbox
  • Execution time: Duration of operations
  • Sandbox creation and initialization
  • Sandbox status changes
  • Sandbox termination
  • Resource allocation and usage
  • Cell execution start and completion
  • Code content and language
  • Execution results (stdout, stderr, return values)
  • Execution errors and stack traces
  • File reads and writes
  • File paths and sizes
  • File system operations
  • Exceptions are recorded with stack traces
  • Proper span status (OK, ERROR)
  • Error messages and codes

Span Attributes

The instrumentation adds the following attributes to each span:
AttributeDescriptionExample
e2b.operationType of operationnotebook.execCell
e2b.sandbox.idSandbox identifiersandbox-abc123
e2b.codeCode being executedprint("Hello")
e2b.languageProgramming languagepython
e2b.outputExecution outputHello\n
e2b.execution.statusExecution statussuccess

Usage Examples

Basic Code Execution

import { CodeInterpreter } from '@e2b/code-interpreter';

const sandbox = await CodeInterpreter.create({
  apiKey: process.env.E2B_API_KEY,
});

// Traced as: e2b.notebook.execCell
const result = await sandbox.notebook.execCell(`
  import numpy as np
  data = np.array([1, 2, 3, 4, 5])
  print(f"Mean: {data.mean()}")
`);

console.log(result.text); // Mean: 3.0

await sandbox.close();

File Operations

import { CodeInterpreter } from '@e2b/code-interpreter';

const sandbox = await CodeInterpreter.create({
  apiKey: process.env.E2B_API_KEY,
});

// Traced as: e2b.filesystem.write
await sandbox.filesystem.write('/data/input.csv', 'name,age\nAlice,30\nBob,25');

// Execute code that uses the file
const result = await sandbox.notebook.execCell(`
  import pandas as pd
  df = pd.read_csv('/data/input.csv')
  print(df.head())
`);

// Traced as: e2b.filesystem.read
const output = await sandbox.filesystem.read('/data/output.csv');

await sandbox.close();

Streaming Execution

import { CodeInterpreter } from '@e2b/code-interpreter';

const sandbox = await CodeInterpreter.create({
  apiKey: process.env.E2B_API_KEY,
});

// Stream execution results - traced from start to finish
const execution = sandbox.notebook.execCell(`
  for i in range(10):
      print(f"Processing {i}")
      time.sleep(0.1)
`);

// Process streaming output
execution.onStdout((output) => {
  console.log('stdout:', output);
});

execution.onStderr((error) => {
  console.error('stderr:', error);
});

await execution;
await sandbox.close();

Complete Integration Example

Here’s a complete example of E2B with OpenTelemetry in a Next.js application:
lib/e2b.ts
import { CodeInterpreter } from '@e2b/code-interpreter';

export async function executeCode(code: string) {
  const sandbox = await CodeInterpreter.create({
    apiKey: process.env.E2B_API_KEY,
  });

  try {
    const result = await sandbox.notebook.execCell(code);
    return {
      success: true,
      output: result.text,
      error: result.error,
    };
  } finally {
    await sandbox.close();
  }
}
instrumentation.ts
import { registerOTel } from '@vercel/otel';
import { E2BInstrumentation } from '@kubiks/otel-e2b';

export function register() {
  registerOTel({
    serviceName: 'your-app',
    instrumentations: [
      new E2BInstrumentation({
        captureCodeContent: true,
        captureOutput: true,
      }),
    ],
  });
}
app/api/execute/route.ts
import { NextRequest, NextResponse } from 'next/server';
import { executeCode } from '@/lib/e2b';

export async function POST(request: NextRequest) {
  const { code } = await request.json();

  // Automatically traced
  const result = await executeCode(code);

  return NextResponse.json(result);
}

Best Practices

Creating sandboxes is expensive. Reuse them for multiple operations:
const sandbox = await CodeInterpreter.create({
  apiKey: process.env.E2B_API_KEY,
});

// Execute multiple cells in the same sandbox
await sandbox.notebook.execCell(code1);
await sandbox.notebook.execCell(code2);
await sandbox.notebook.execCell(code3);

await sandbox.close();
Set appropriate timeouts for long-running code:
const sandbox = await CodeInterpreter.create({
  apiKey: process.env.E2B_API_KEY,
  timeout: 60_000, // 60 seconds
});
Always close sandboxes to avoid resource leaks:
try {
  const result = await sandbox.notebook.execCell(code);
  return result;
} finally {
  await sandbox.close();
}
Use traces to understand sandbox usage patterns and optimize costs.

Performance Considerations

The instrumentation adds minimal overhead for tracing operations.
Use OpenTelemetry sampling for high-volume applications:
import { TraceIdRatioBasedSampler } from '@opentelemetry/sdk-trace-base';

registerOTel({
  serviceName: 'your-app',
  sampler: new TraceIdRatioBasedSampler(0.1), // Sample 10% of traces
});

Troubleshooting

Ensure OpenTelemetry is initialized before creating E2B sandboxes:
// In instrumentation.ts or instrumentation.node.ts
export function register() {
  registerOTel({
    serviceName: 'your-app',
    instrumentations: [new E2BInstrumentation()],
  });
}
Check that captureCodeContent is enabled:
new E2BInstrumentation({
  captureCodeContent: true,
  maxCodeLength: 2000,
})
Verify your E2B API key is set correctly:
const sandbox = await CodeInterpreter.create({
  apiKey: process.env.E2B_API_KEY, // Make sure this is set
});

Resources

License

MIT