

Overview
@kubiks/otel-upstash-workflow provides comprehensive OpenTelemetry instrumentation for the Upstash Workflow SDK. Capture spans for workflow executions, steps, sleep operations, API calls, and event waiting with detailed performance metrics.
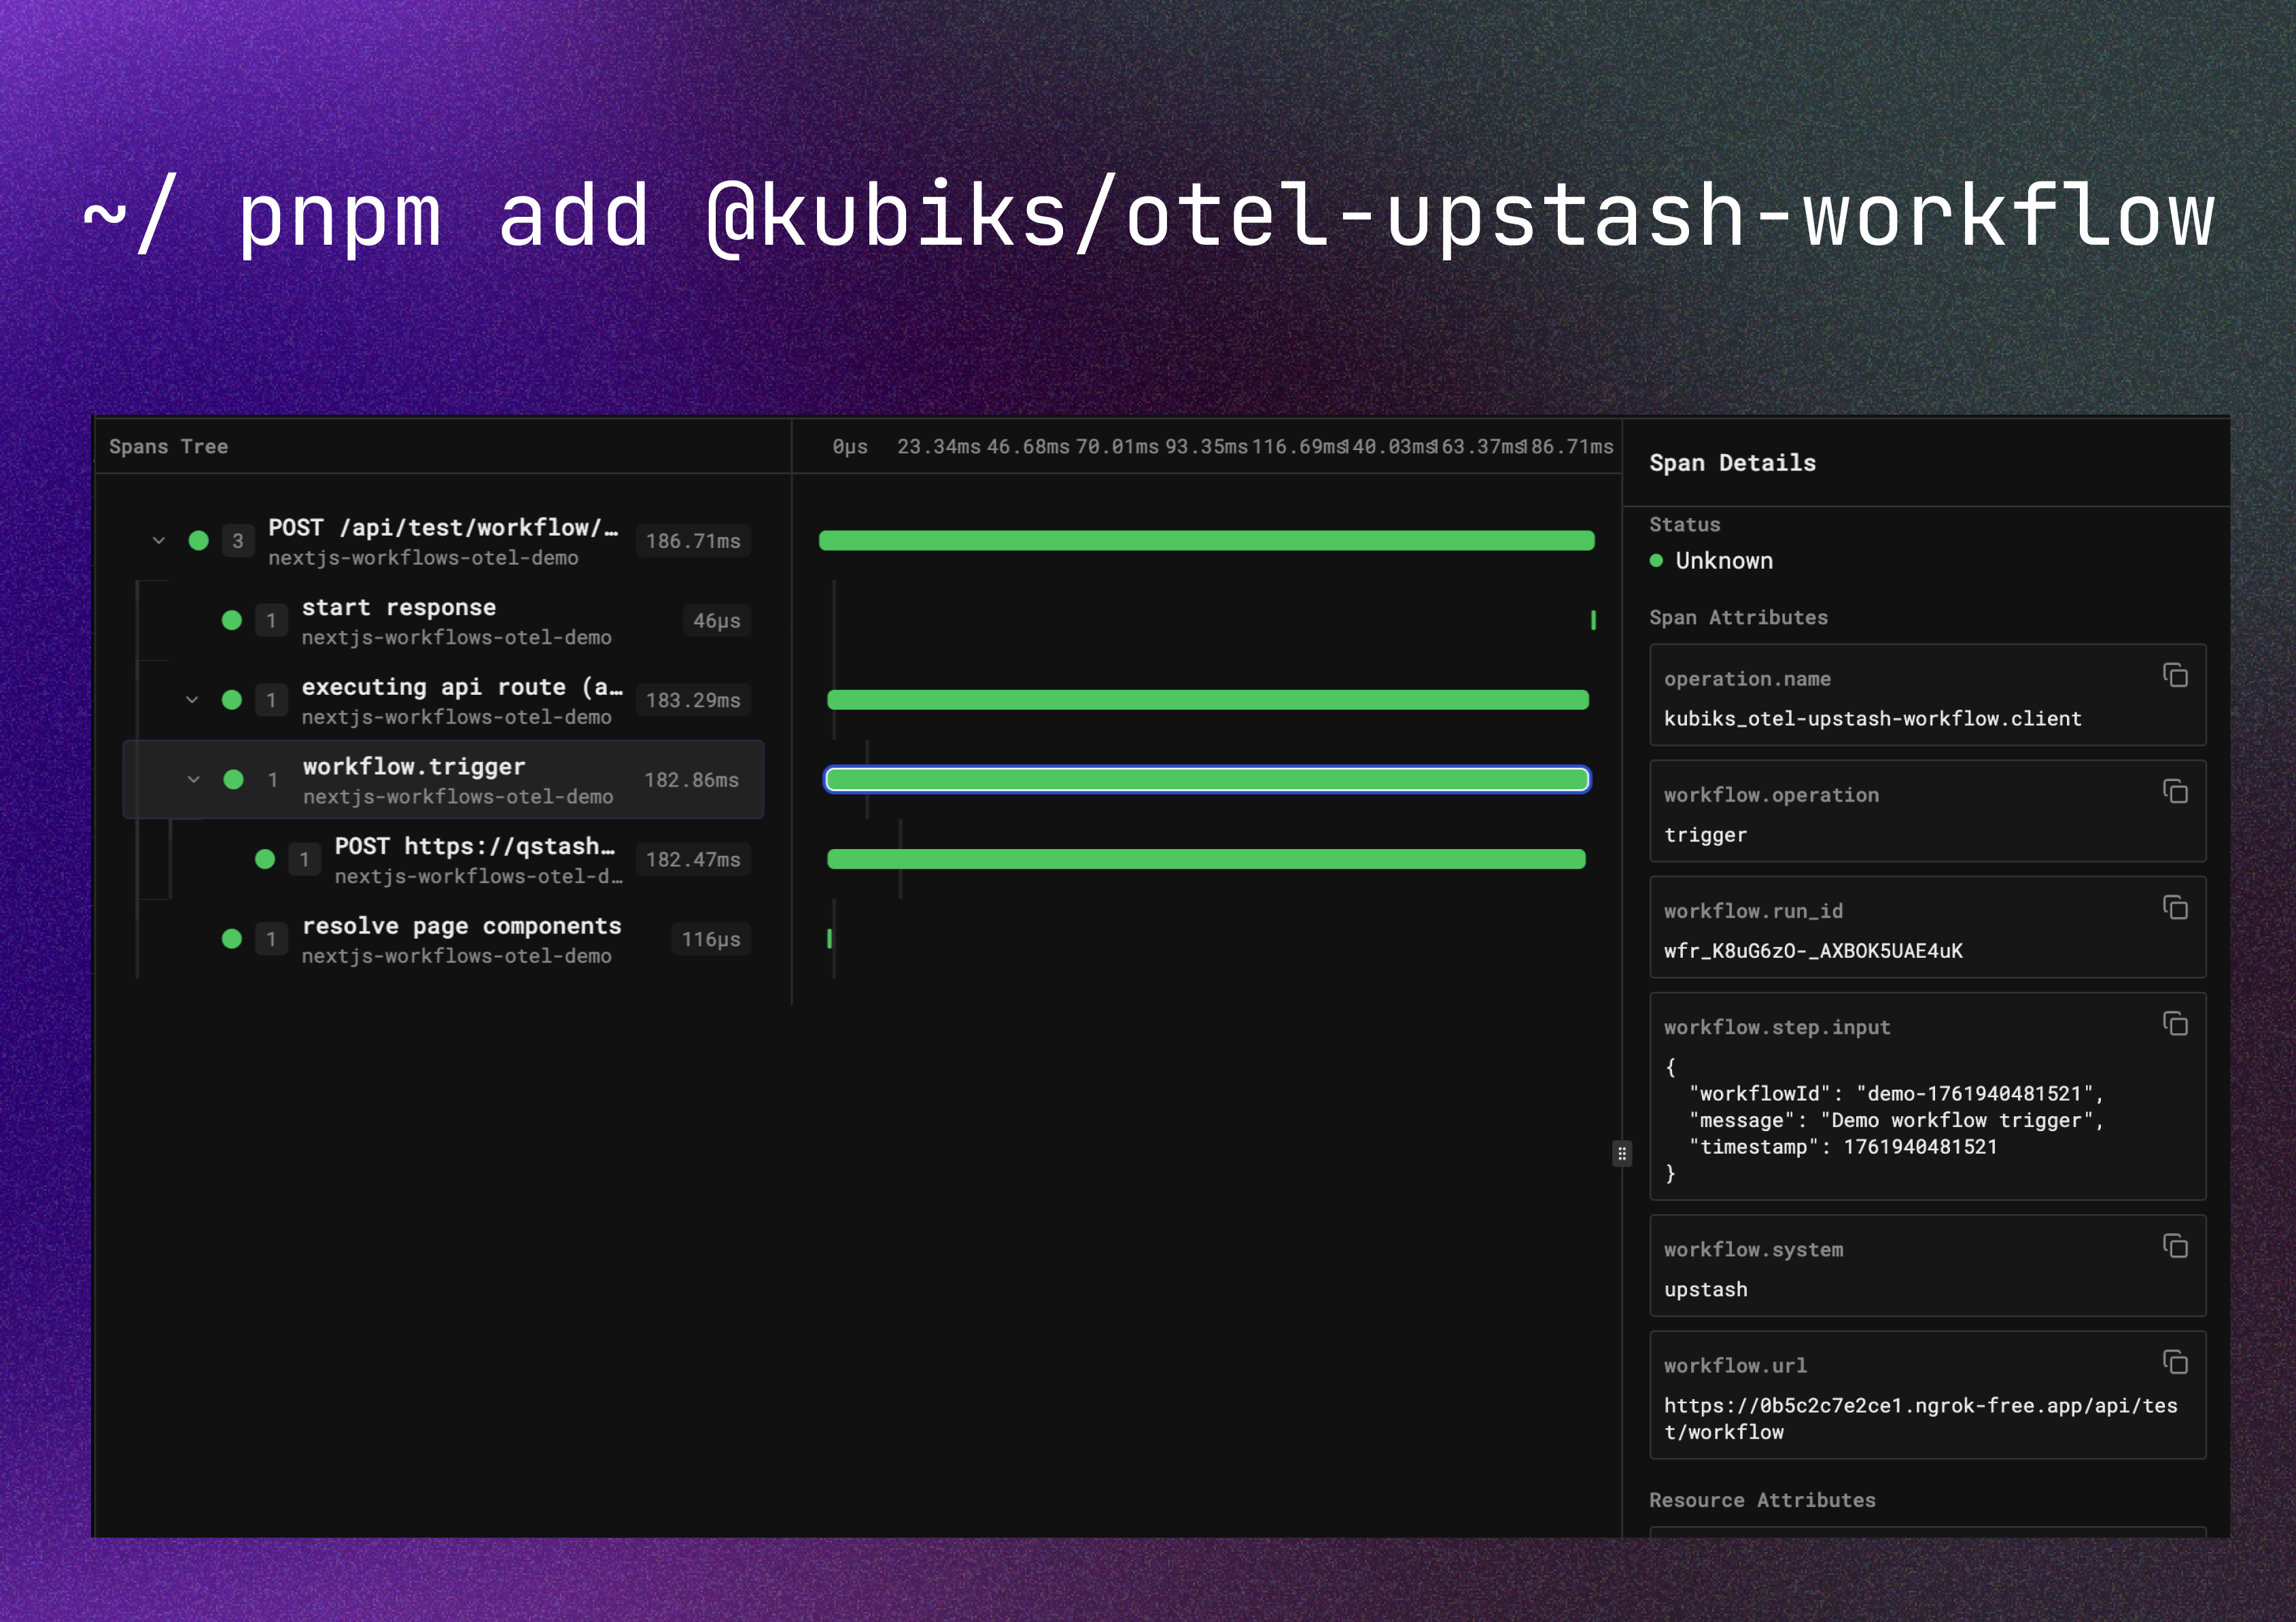
Visualize your workflow executions with detailed span information including steps, sleep operations, API calls, and performance metrics.
Installation
Quick Start
Instrumenting Workflow Handlers
Instrumenting Workflow Client
Configuration
With Step Data Capture
Optionally capture step inputs and outputs for debugging:What Gets Traced
This instrumentation provides two main functions:instrumentWorkflowClient
Wraps the Workflow Client to trace workflow triggers with
SpanKind.CLIENTinstrumentWorkflowServe
Wraps the serve function to trace execution and all workflow steps with
SpanKind.SERVERWorkflow Handler Instrumentation
TheinstrumentWorkflowServe function wraps the serve function, creating a span with SpanKind.SERVER for the entire workflow execution. All workflow steps (context.run, context.sleep, etc.) automatically create child spans.
Client Instrumentation
TheinstrumentWorkflowClient function wraps the client’s trigger method, creating a span with SpanKind.CLIENT for each workflow trigger operation.
Span Hierarchy
The instrumentation creates the following span hierarchy:Span Attributes
Workflow Handler Spans (instrumentWorkflowServe)
Client Trigger Spans (instrumentWorkflowClient)
Step Spans (context.run)
Sleep Spans (context.sleep, context.sleepFor, context.sleepUntil)
Call Spans (context.call)
Event Spans (context.waitForEvent)
Step Data Attributes (Optional)
WhencaptureStepData is enabled:
The instrumentation captures workflow metadata and step details to help with debugging and monitoring. Step data capture is disabled by default to protect sensitive data.
Usage Examples
Basic Workflow Execution
Workflow with Sleep
Workflow with External API Calls
Workflow with Event Waiting
Client Triggering Workflows
With Step Data Capture
Complete Next.js Integration Example
Workflow Handler
app/api/workflow/route.ts
Triggering Workflows
app/actions.ts
Configuration Options
Best Practices
Name Your Steps Meaningfully
Name Your Steps Meaningfully
Use descriptive step names to make traces easier to understand:
Use Named Sleeps for Clarity
Use Named Sleeps for Clarity
Name sleep operations to understand workflow timing:
Limit Step Data Capture
Limit Step Data Capture
Only enable step data capture in development or when data doesn’t contain sensitive information:
Handle Errors in Steps
Handle Errors in Steps
Implement proper error handling within workflow steps:
Troubleshooting
Spans Not Appearing
Spans Not Appearing
Ensure OpenTelemetry is initialized before using workflows:
Missing Environment Variables
Missing Environment Variables
Make sure required environment variables are set:
Workflow Not Executing
Workflow Not Executing
Check that your endpoint is:
- Publicly accessible
- Returns 2xx status codes
- Properly configured with Upstash Workflow
Resources
Upstash Workflow Documentation
Learn more about Upstash Workflow
GitHub Repository
View source code and examples
npm Package
View package on npm
Report Issues
Found a bug? Let us know!