

Overview
@kubiks/otel-drizzle provides comprehensive OpenTelemetry instrumentation for Drizzle ORM. Add distributed tracing to your database queries with a single line of code—supports PostgreSQL, MySQL, and SQLite.
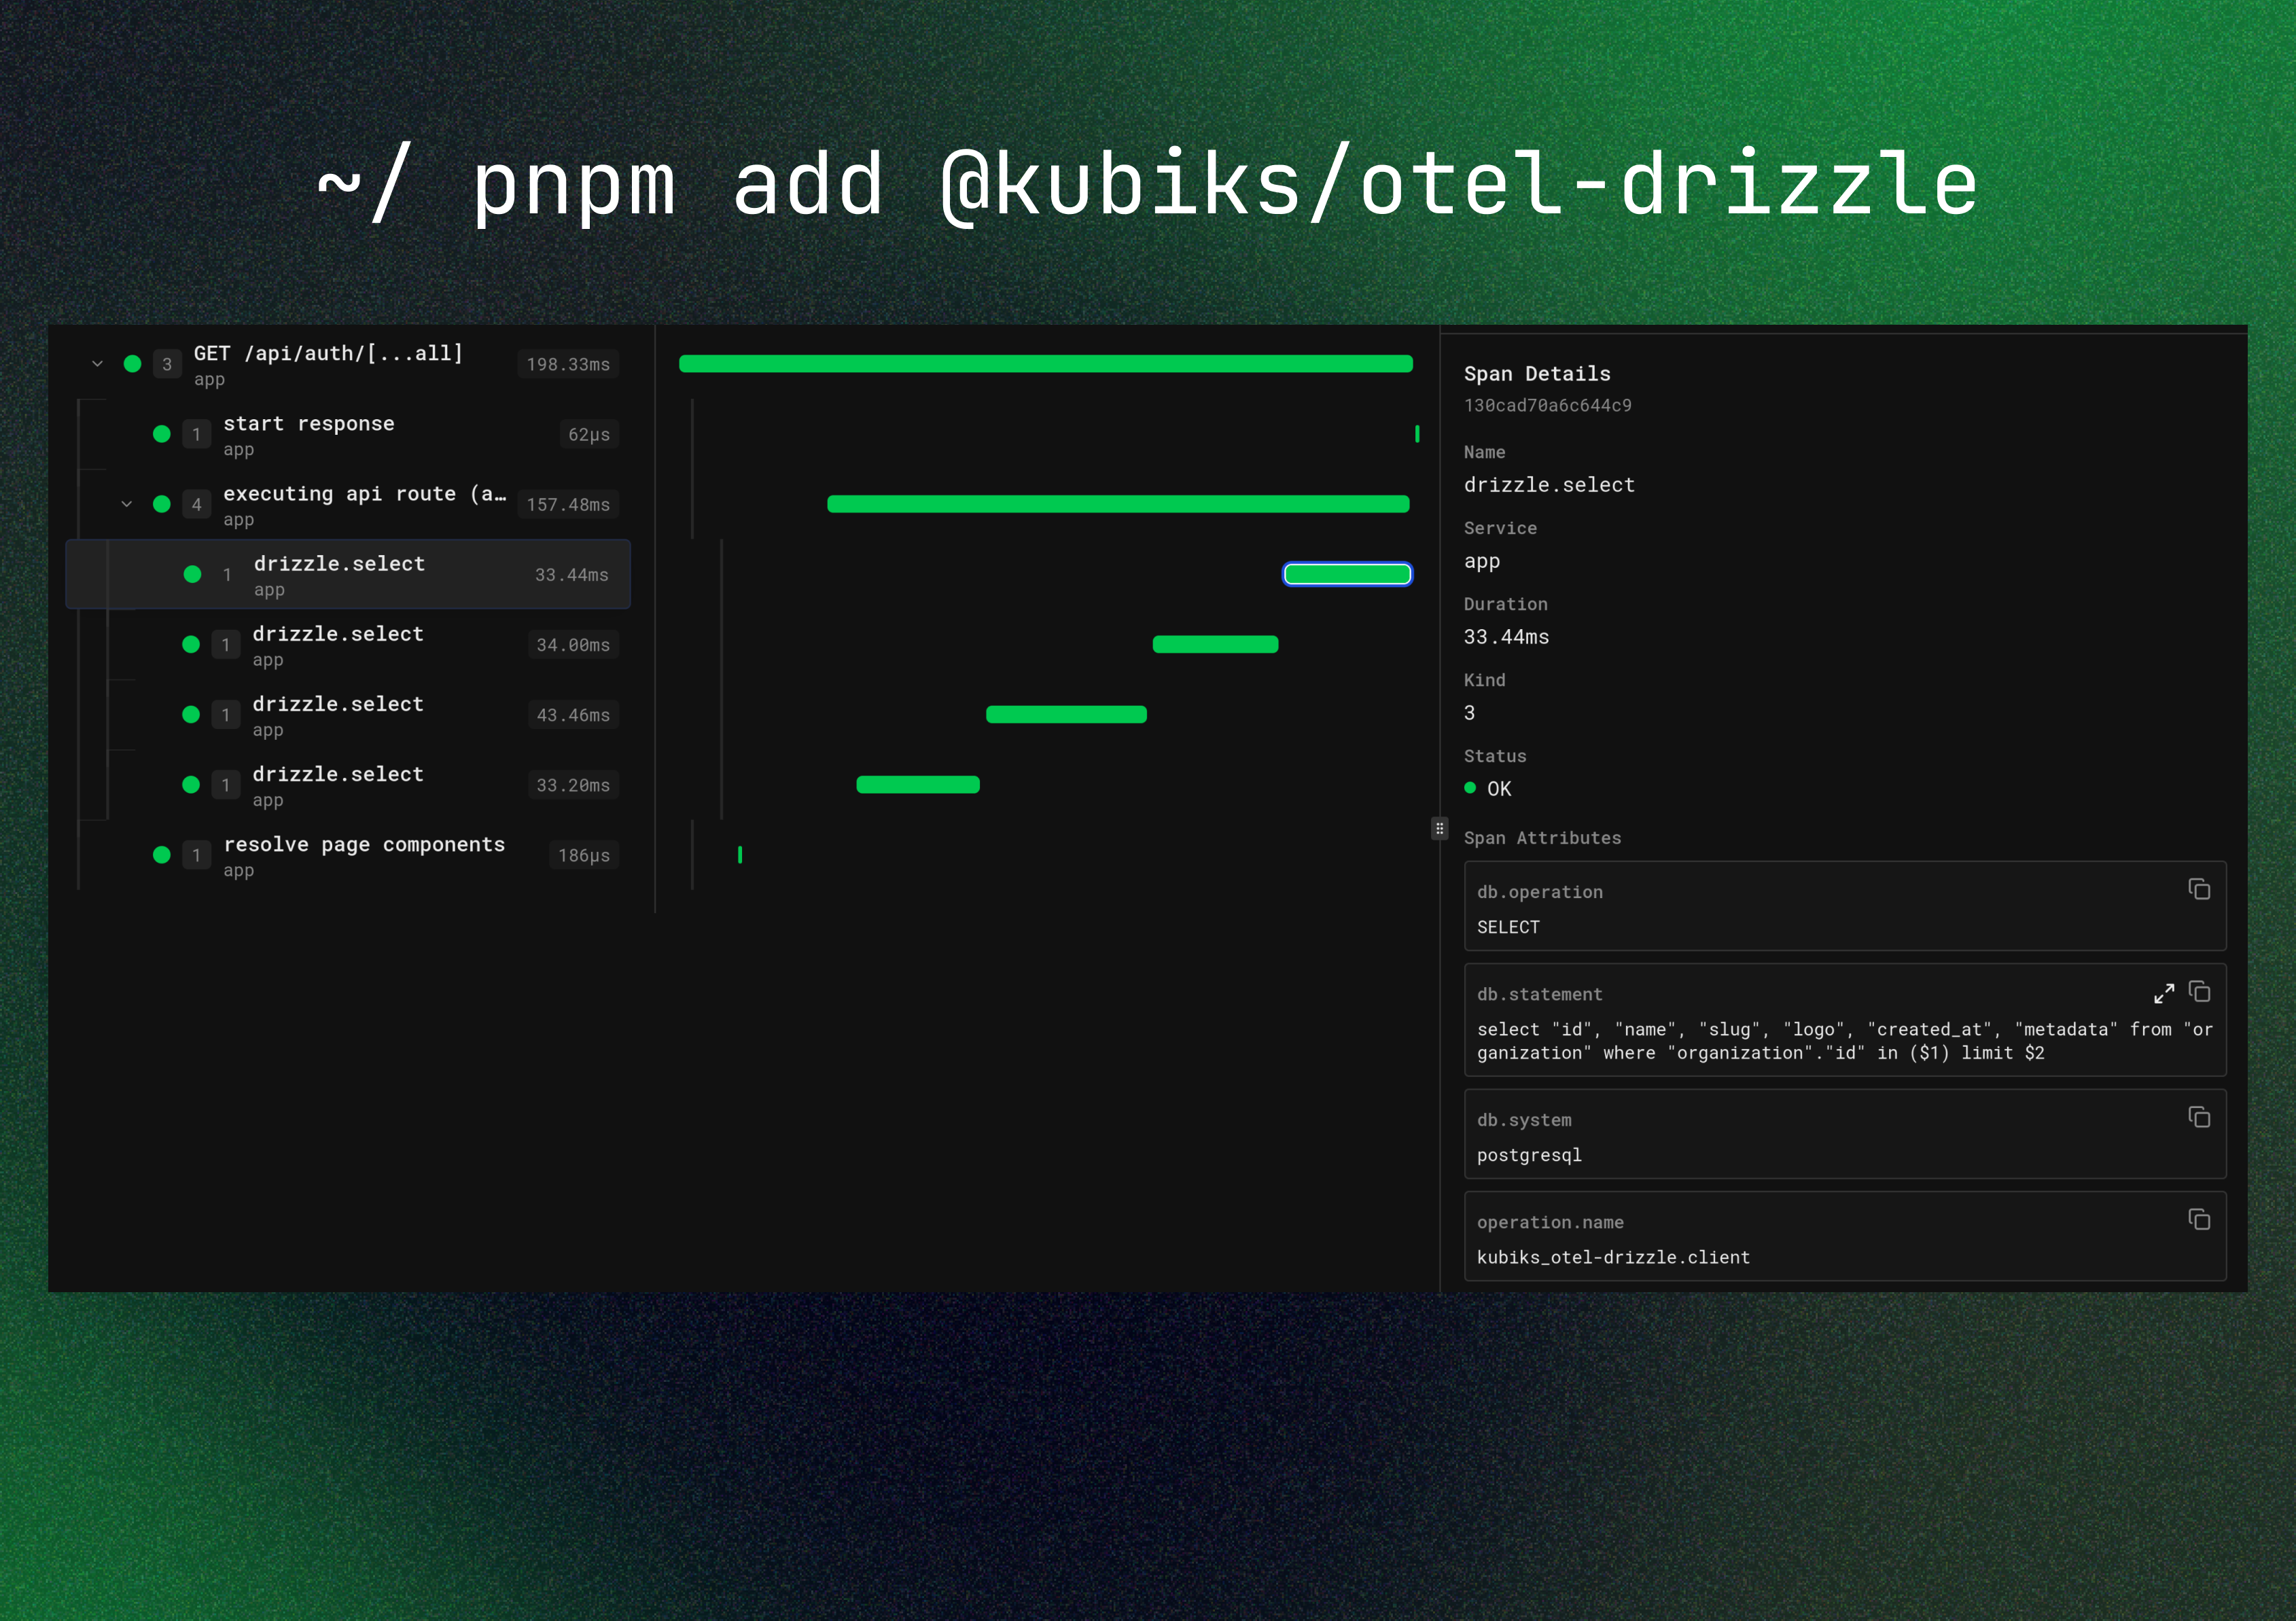
Visualize your database queries with detailed span information including operation type, SQL statements, and performance metrics.
Installation
Supported Frameworks
Works with any TypeScript framework and Node.js runtime that Drizzle supports:Next.js
App Router & Pages Router
Fastify
High-performance server
NestJS
Enterprise framework
Express
Classic Node.js server
Remix
Full-stack framework
SvelteKit
Modern web framework
Supported Platforms
Works with any observability platform that supports OpenTelemetry:Quick Start
UseinstrumentDrizzleClient() to add tracing to your Drizzle database instance:
Database-Specific Setup
- PostgreSQL
- MySQL
- SQLite
postgres.js
postgres.js
node-postgres (pg)
node-postgres (pg)
Configuration Options
By default, SQL queries are captured in spans. You can disable this by setting
captureQueryText: false for sensitive environments.What You Get
Each database query automatically creates a span with rich telemetry data:Span Information
Span Information
- Span name:
drizzle.select,drizzle.insert,drizzle.update, etc. - Operation type:
db.operationattribute (SELECT, INSERT, UPDATE, DELETE, SET) - SQL query text: Full query statement captured in
db.statement(configurable) - Database system:
db.systemattribute (postgresql, mysql, sqlite, etc.)
Transaction Support
Transaction Support
All queries within transactions are automatically traced, including:
- RLS (Row Level Security) queries like
SET LOCAL roleandset_config() - All nested transaction queries
- Transaction rollbacks and commits
Error Tracking
Error Tracking
- Exceptions are recorded with stack traces
- Proper span status (OK, ERROR)
- Error messages and types
Performance Metrics
Performance Metrics
- Duration and timing information for every query
- Query execution time
- Database connection time
Span Attributes
The instrumentation adds the following attributes to each span following OpenTelemetry semantic conventions:Usage Examples
Basic Queries
Transactions
Transaction queries are automatically marked with
db.transaction attribute.Complex Queries
Row Level Security (PostgreSQL)
Complete Integration Example
Here’s a complete example of Drizzle ORM with OpenTelemetry in a Next.js application:lib/db.ts
db/schema.ts
app/api/users/route.ts
Best Practices
Use Connection Pooling
Use Connection Pooling
Always use connection pooling in production:
Configure SQL Capture Wisely
Configure SQL Capture Wisely
Disable SQL capture in production if queries contain sensitive data:
Use Transactions for Data Integrity
Use Transactions for Data Integrity
Always use transactions for multi-step operations:
Index Your Queries
Index Your Queries
Monitor slow queries in your traces and add indexes:
Performance Considerations
Minimal Overhead
Minimal Overhead
The instrumentation adds minimal overhead (~1-2ms per query) for tracing operations.
Sampling
Sampling
Use OpenTelemetry sampling to reduce data volume in high-traffic applications:
Batch Span Processing
Batch Span Processing
Use batch span processors for better performance:
Troubleshooting
Spans Not Appearing
Spans Not Appearing
Ensure OpenTelemetry is initialized before instrumenting Drizzle:
SQL Not Captured
SQL Not Captured
Check that
captureQueryText is enabled:Transaction Queries Not Grouped
Transaction Queries Not Grouped
Make sure you’re using Drizzle’s transaction API correctly:
Resources
Drizzle ORM Documentation
Learn more about Drizzle ORM
GitHub Repository
View source code and examples
npm Package
View package on npm
Report Issues
Found a bug? Let us know!