> ## Documentation Index
> Fetch the complete documentation index at: https://docs.kubiks.ai/llms.txt
> Use this file to discover all available pages before exploring further.
# Vercel Integration
> AI-powered observability for Vercel apps with zero-config setup
## Overview
Kubiks is an AI-powered observability platform for Vercel apps. It automatically traces every part of your stack — API routes, database queries, background jobs, and LLM calls — using OpenTelemetry for full visibility with zero setup.
**Key Features:**
* **AI Agent** that monitors your stack, detects issues, and generates PRs with fixes
* **Automatic Tracing** across logs, traces, and source code
* **Real-time Root-Cause Analysis** and incident summaries
* **Unified Dashboard** for complete system visibility
* **Slack Integration** to chat with the agent and trigger actions
Built for speed and clarity, Kubiks helps you understand and fix issues instantly.
## Quick Setup
### 1. Enable Log Drains (Required)
Vercel Log Drains automatically forward your application's real-time logs (build, edge, serverless, runtime, and static) to Kubiks.
**Log Drains are required** for Kubiks to display all requests and correlate them with traces.
Navigate to the Integration page and click the **Add Drains** button.
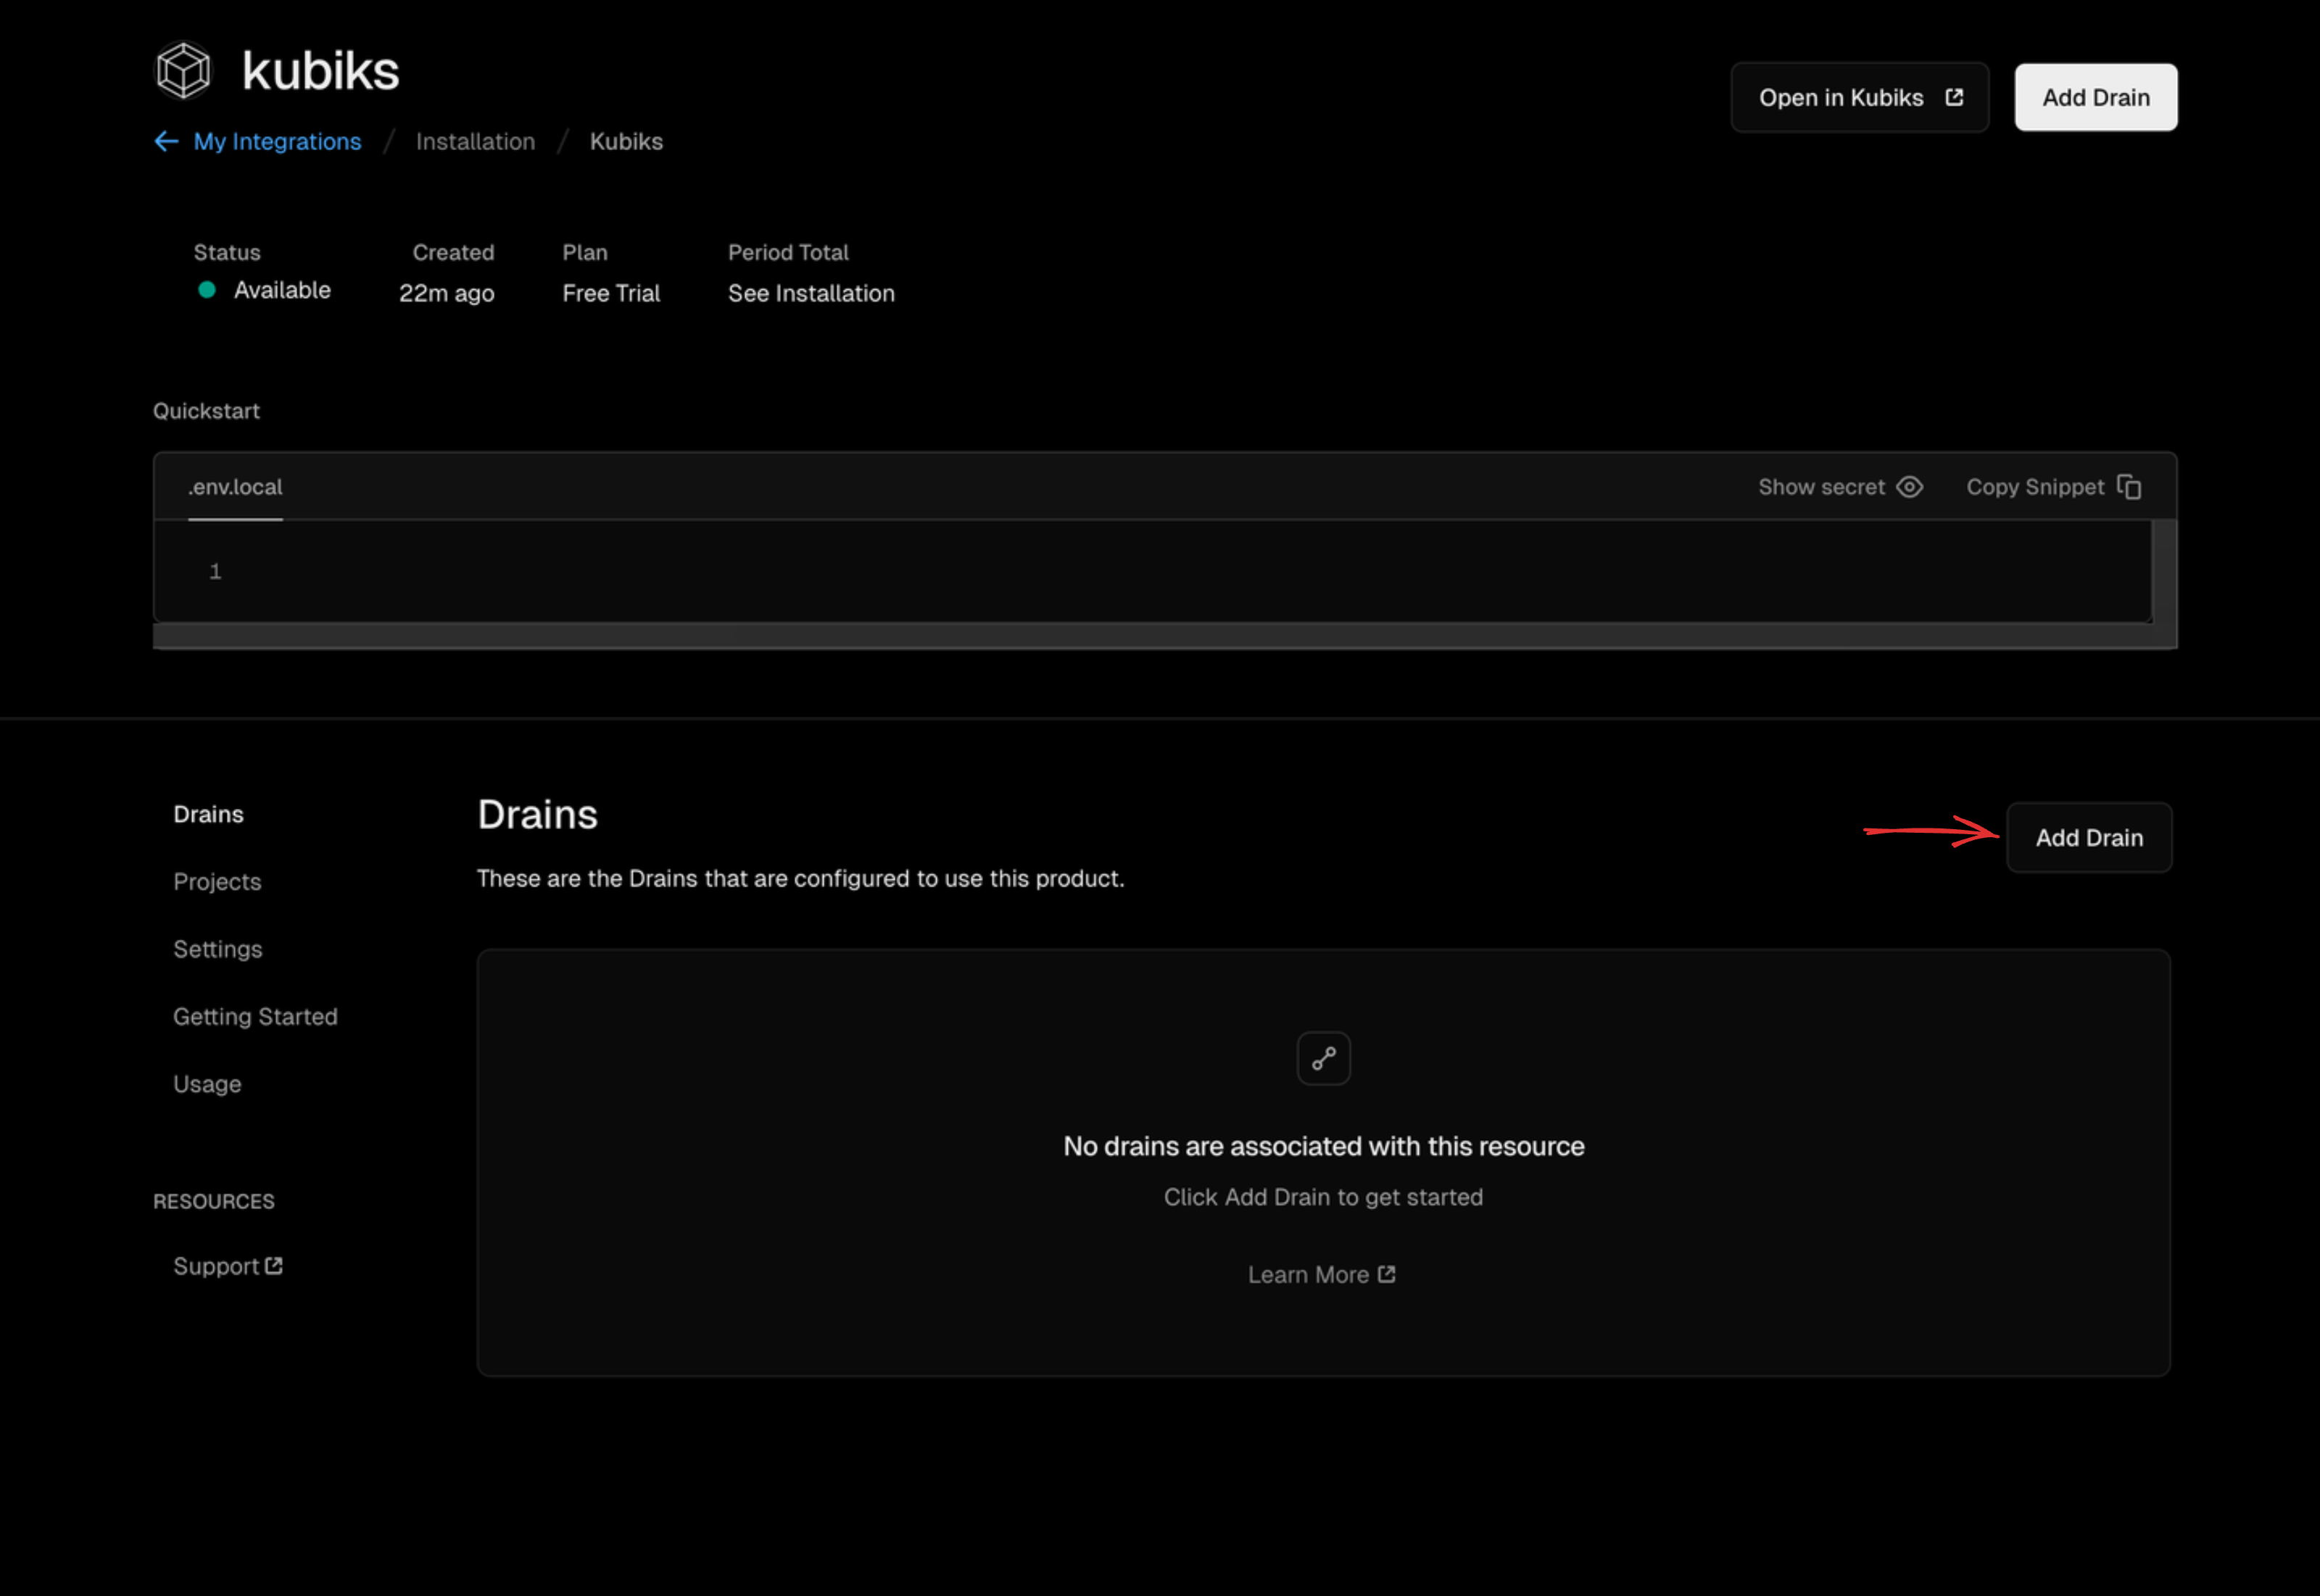 Select **Logs** and click **Next**.
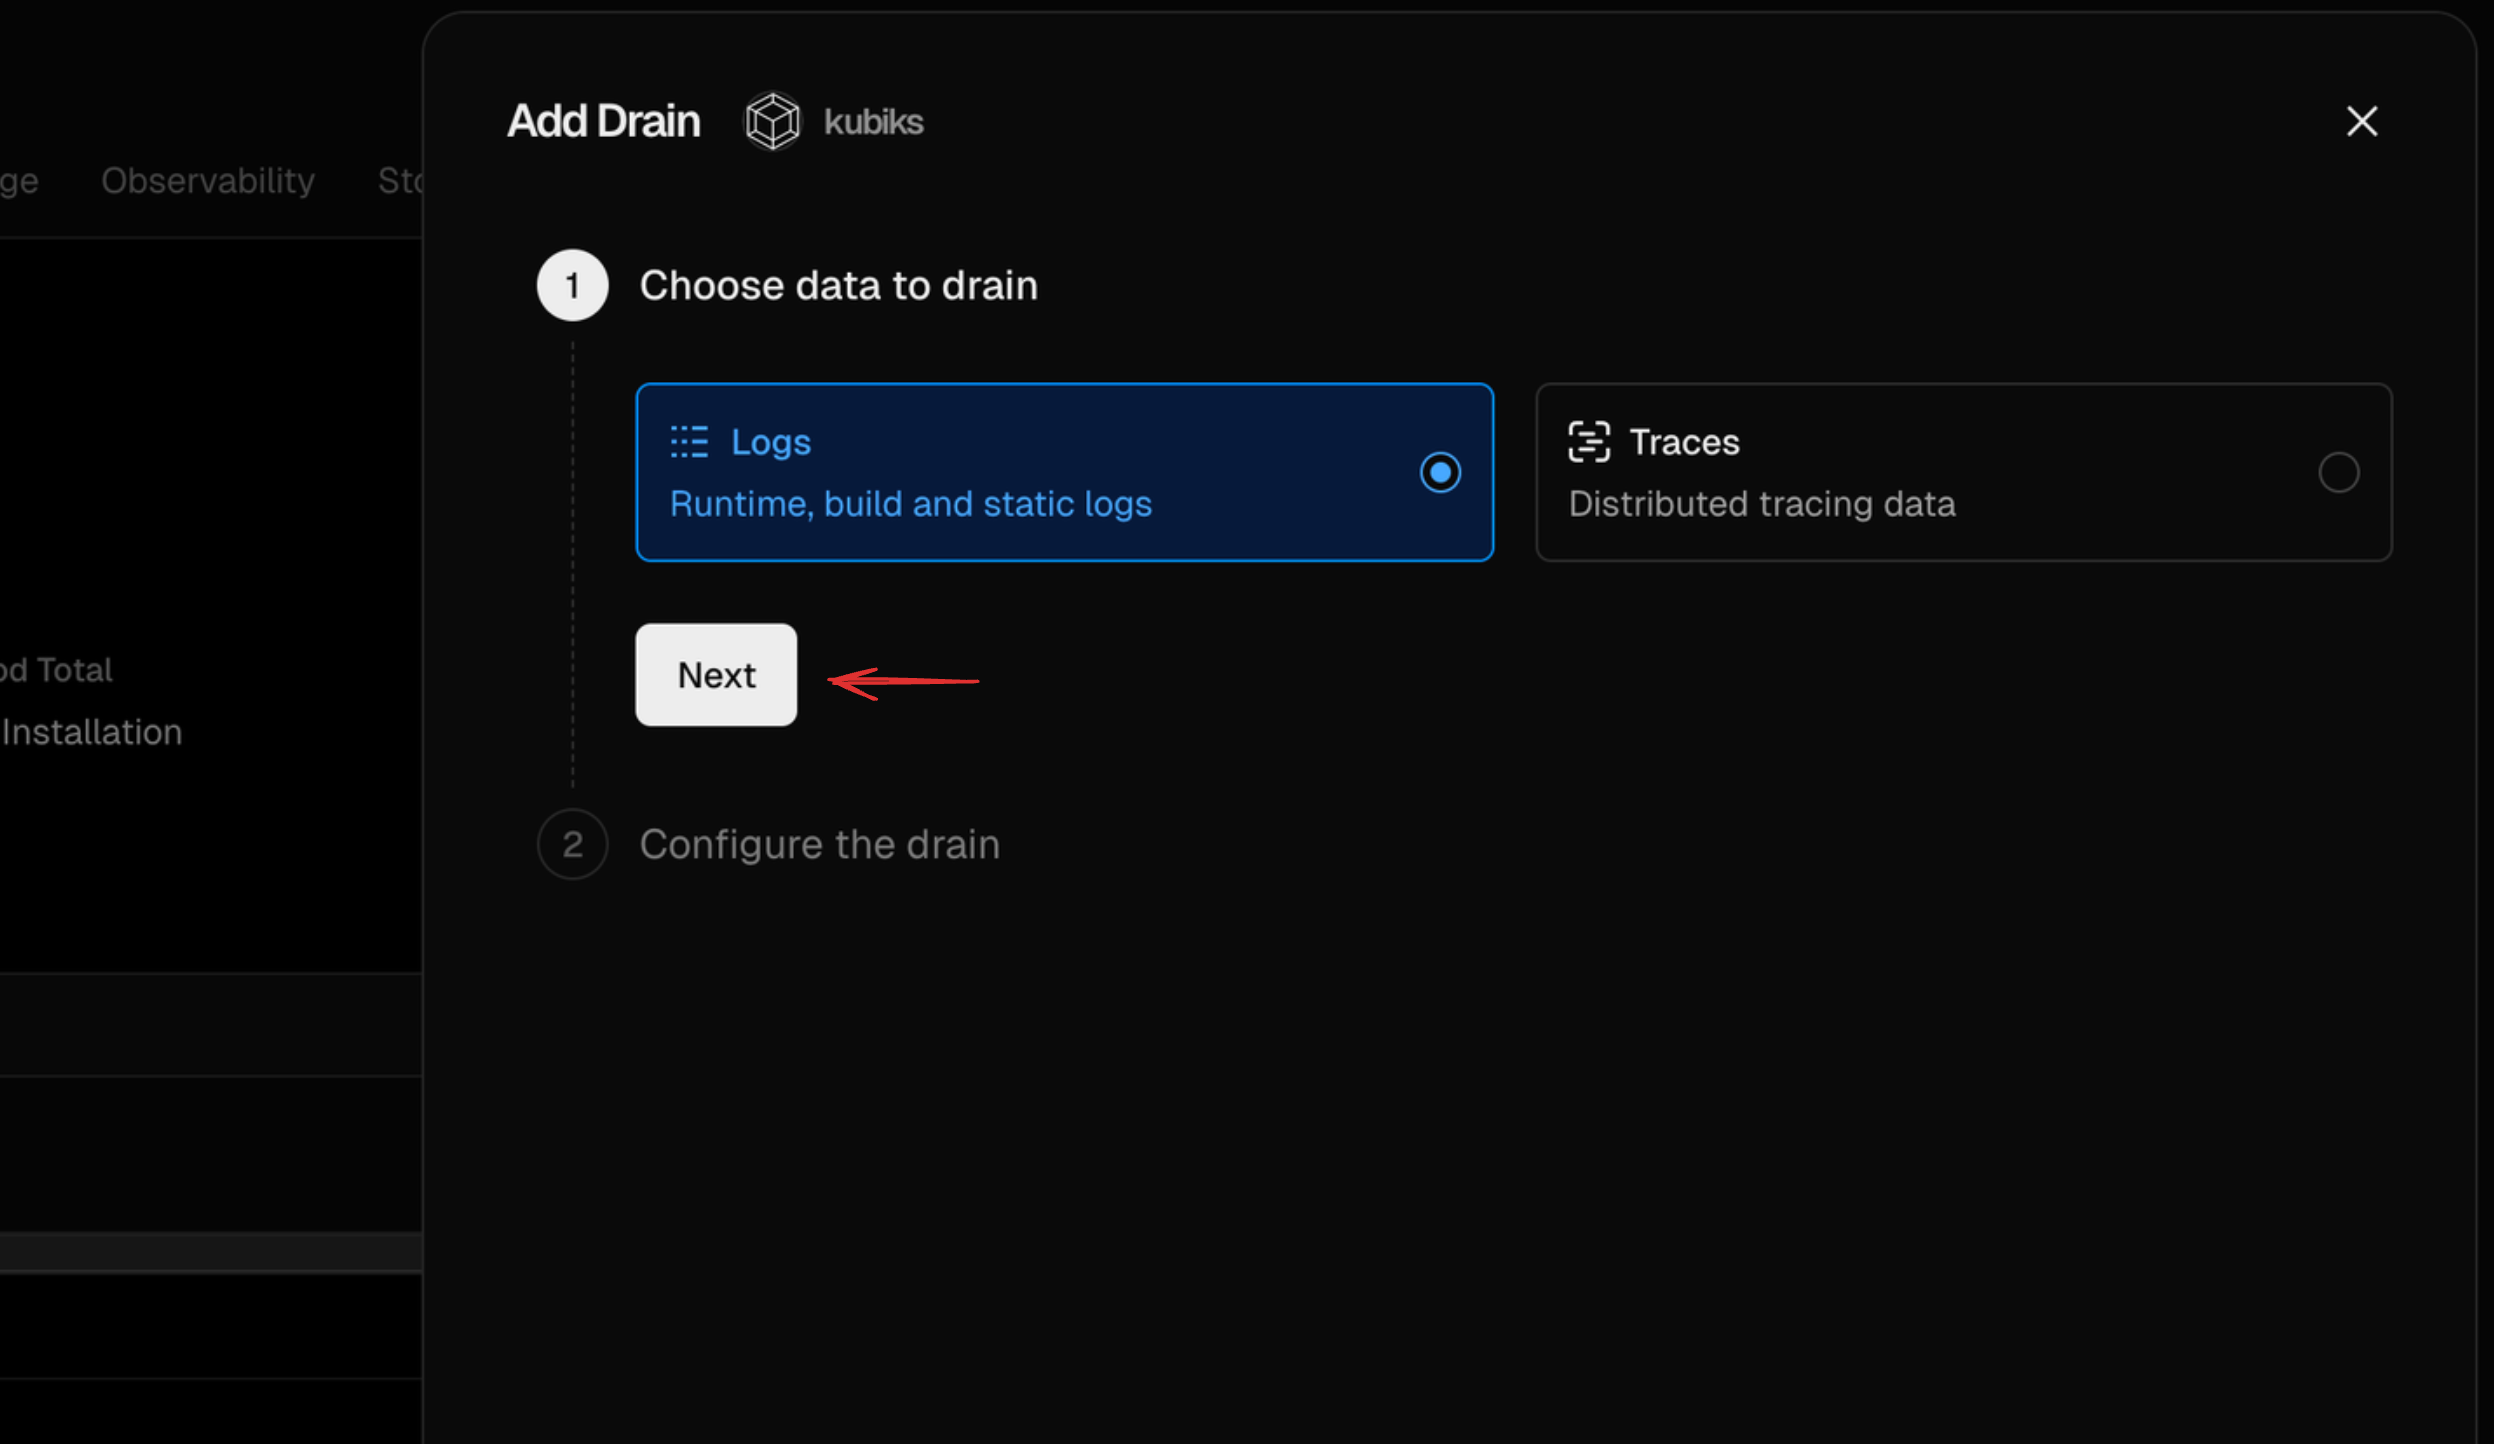 Configure the drain settings and click **Create Drain** to complete the setup.
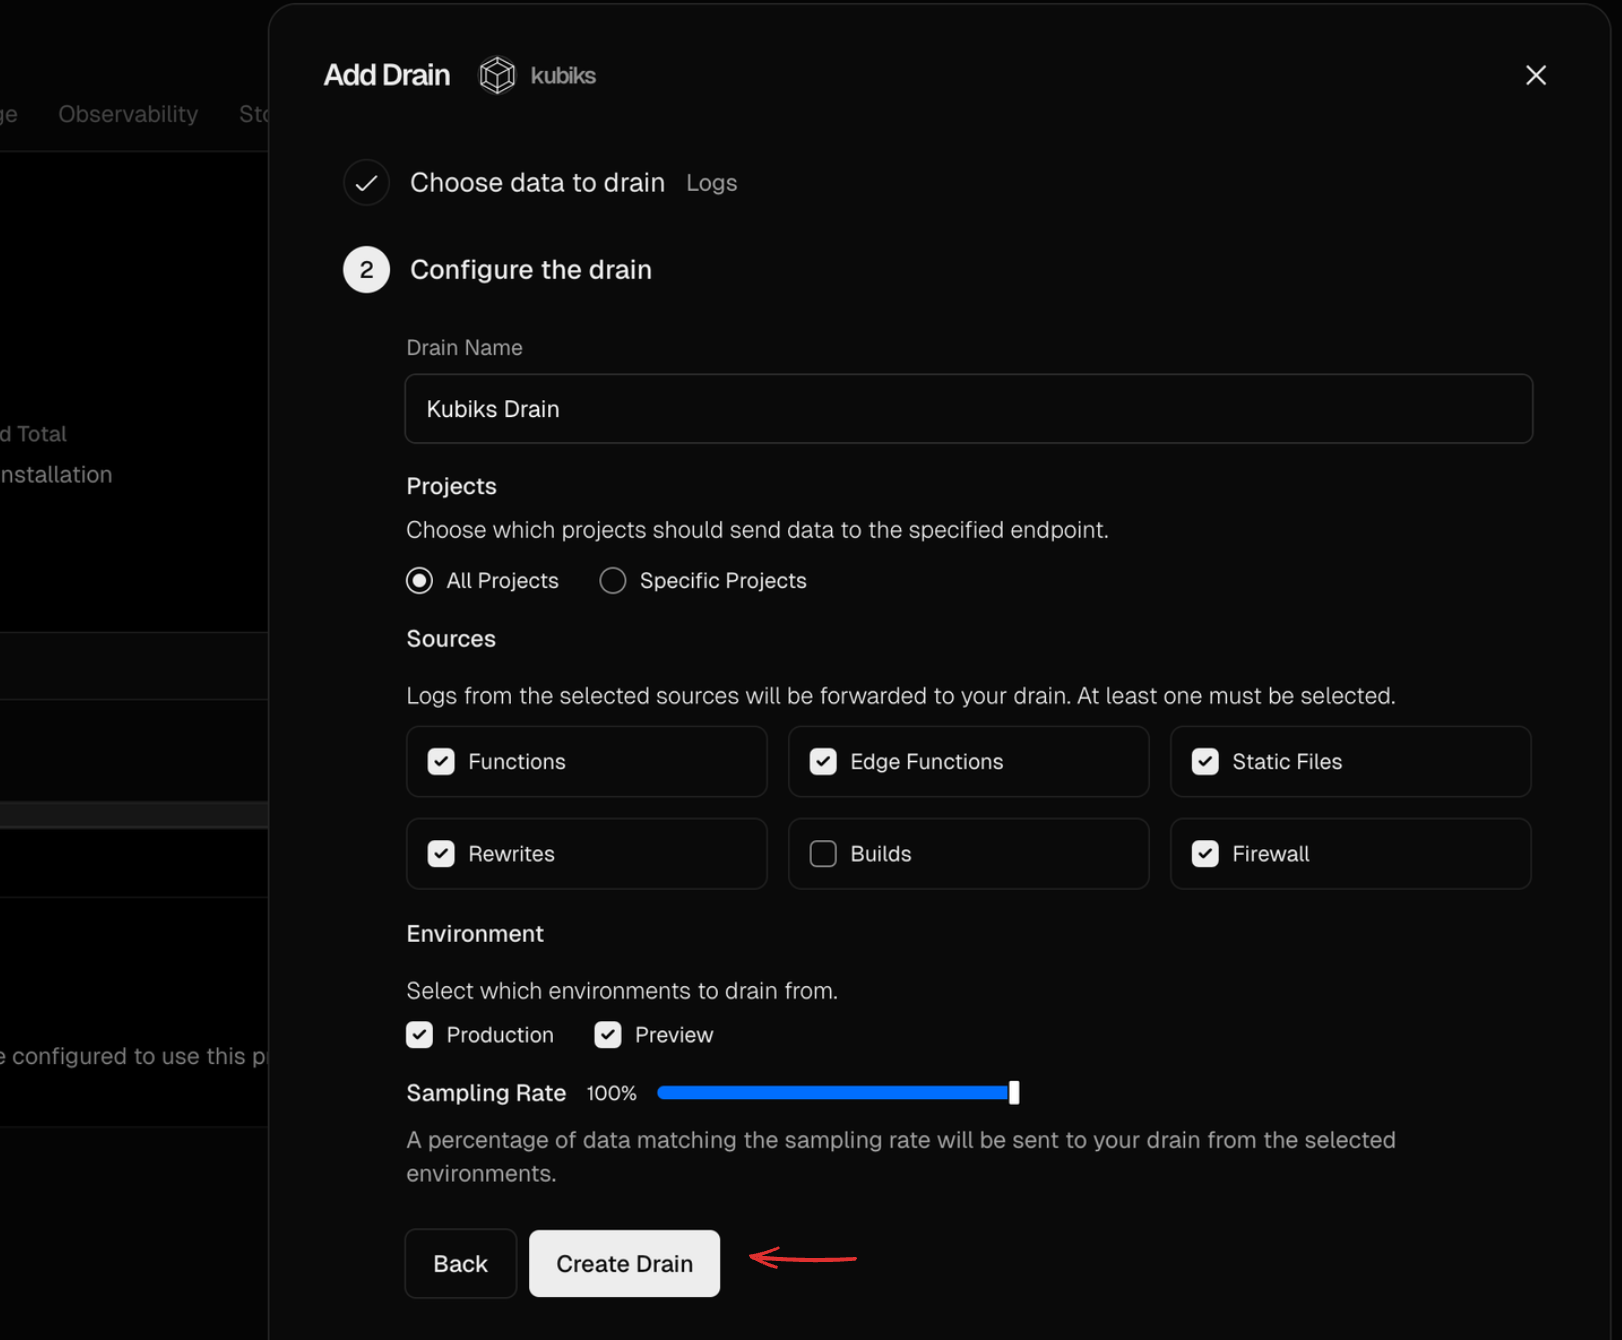 Log drains are required for Kubiks to visualize requests data.
### 2. Enable Trace Drains
Trace Drains send spans from your Vercel project to Kubiks, providing full request-level tracing and visibility.
Navigate to the Integration page and click the **Add Drains** button.
Log drains are required for Kubiks to visualize requests data.
### 2. Enable Trace Drains
Trace Drains send spans from your Vercel project to Kubiks, providing full request-level tracing and visibility.
Navigate to the Integration page and click the **Add Drains** button.
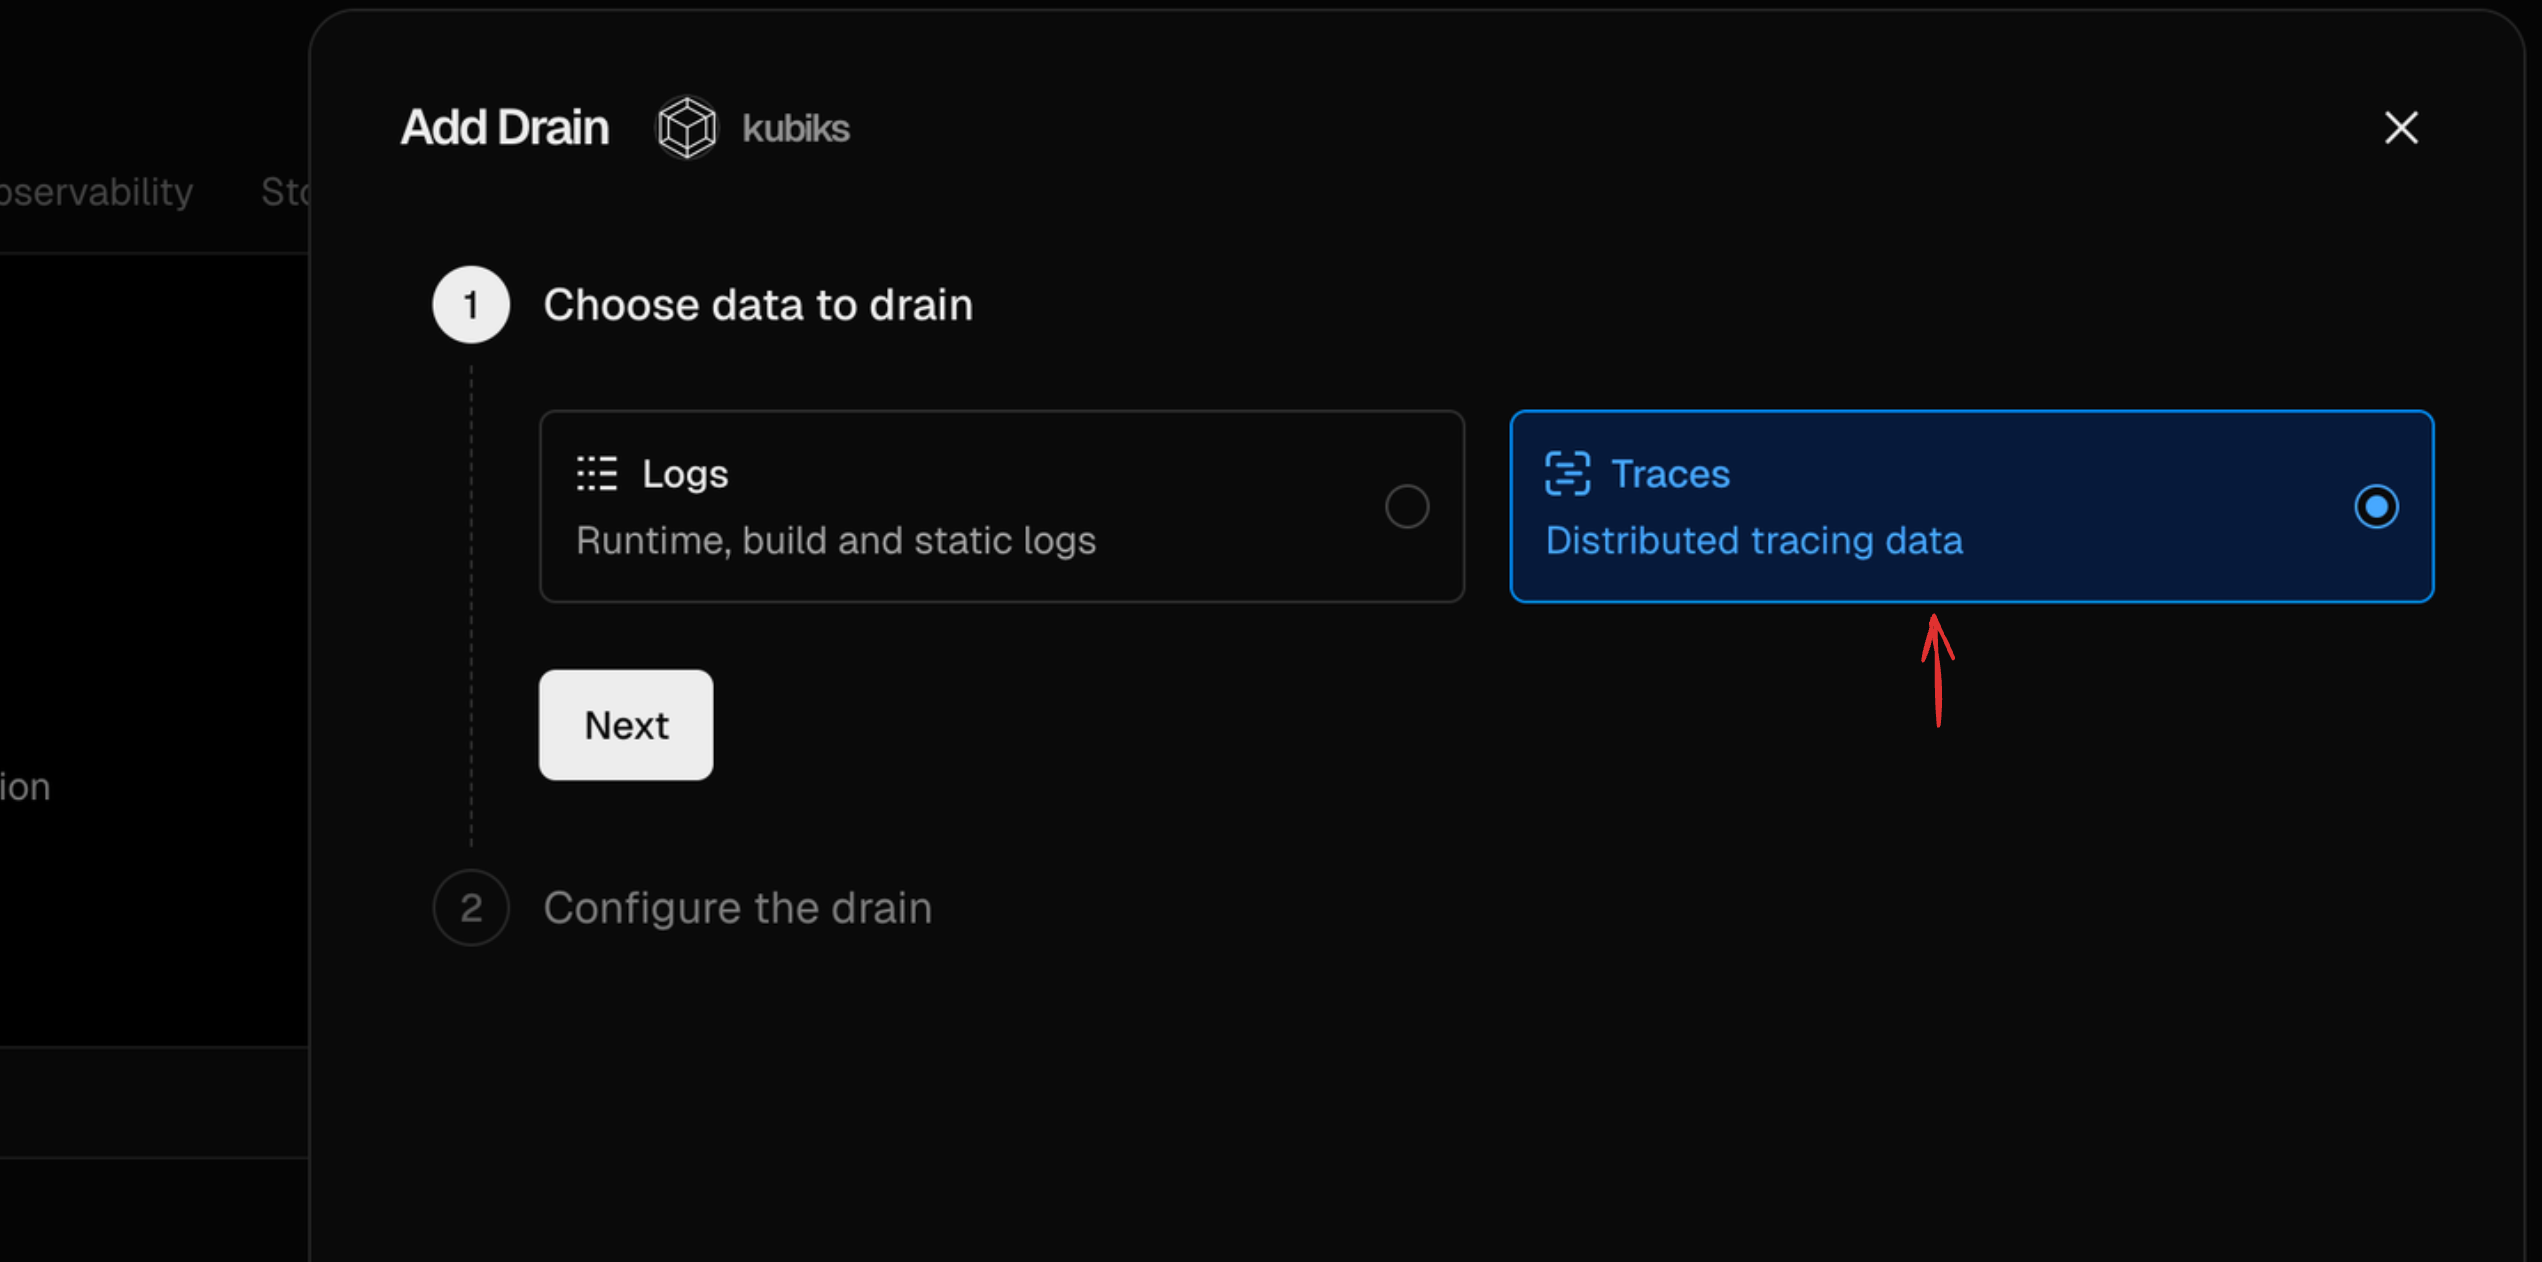
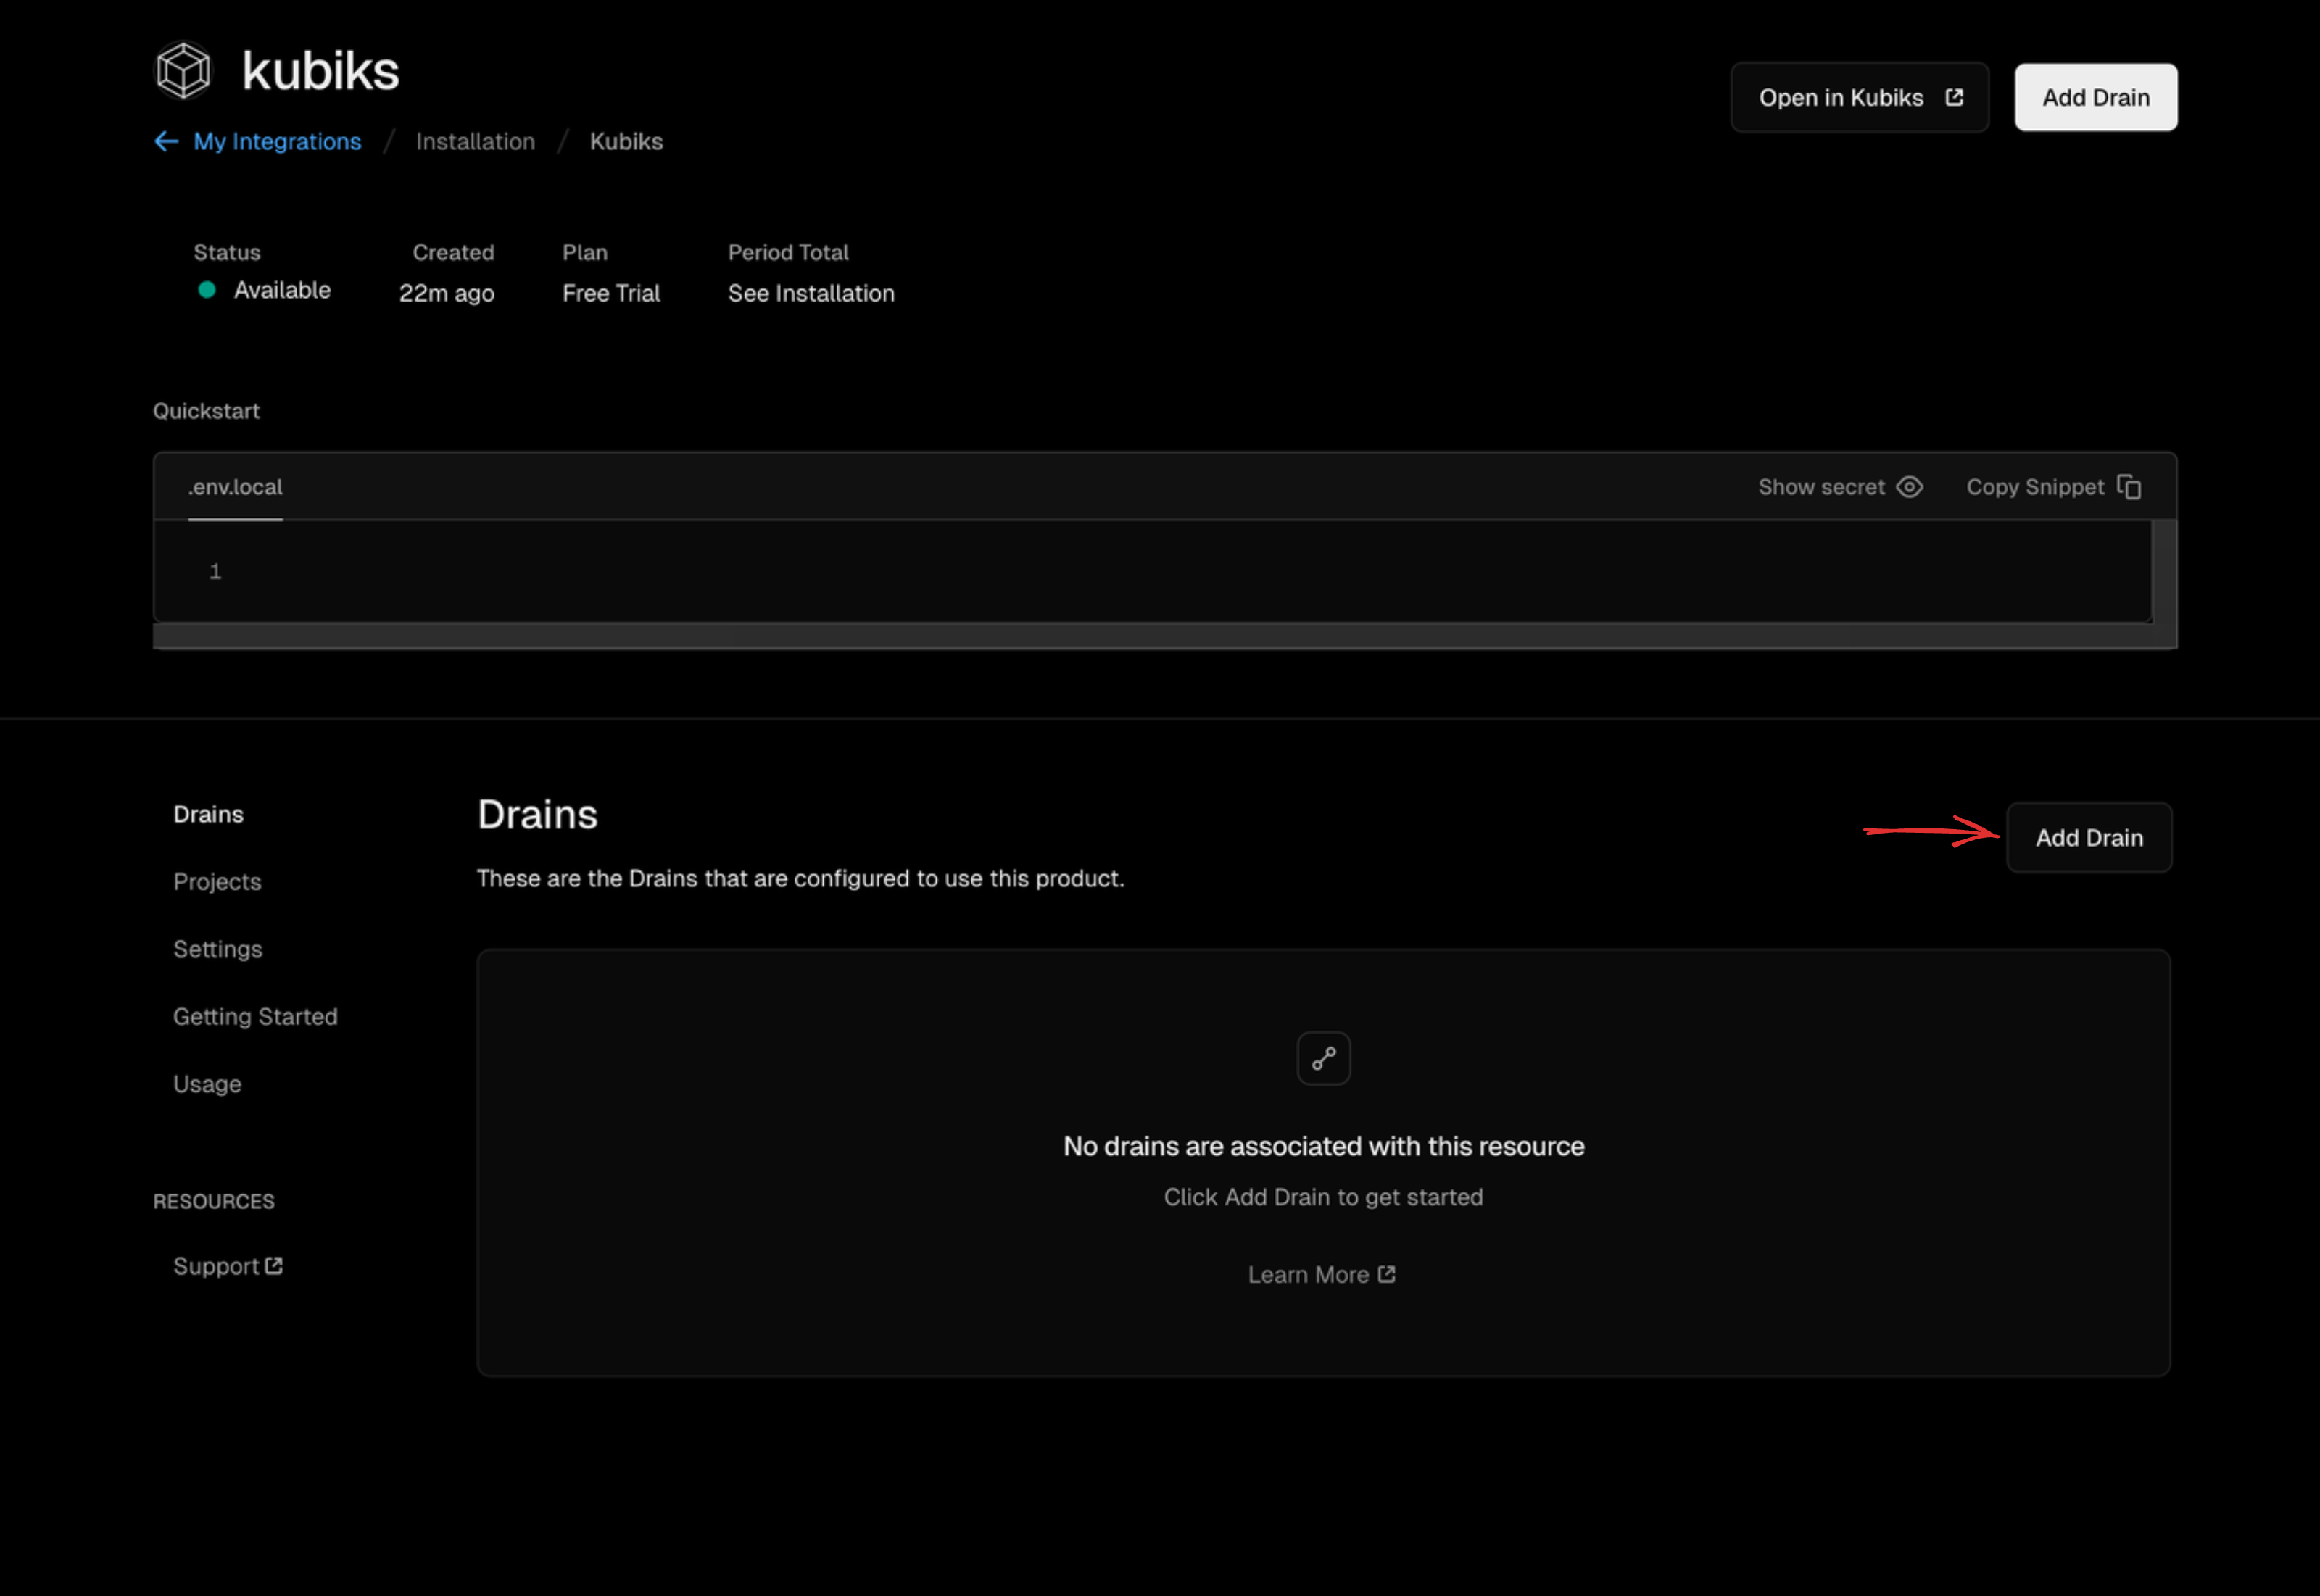 Select **Traces** and click **Next**.
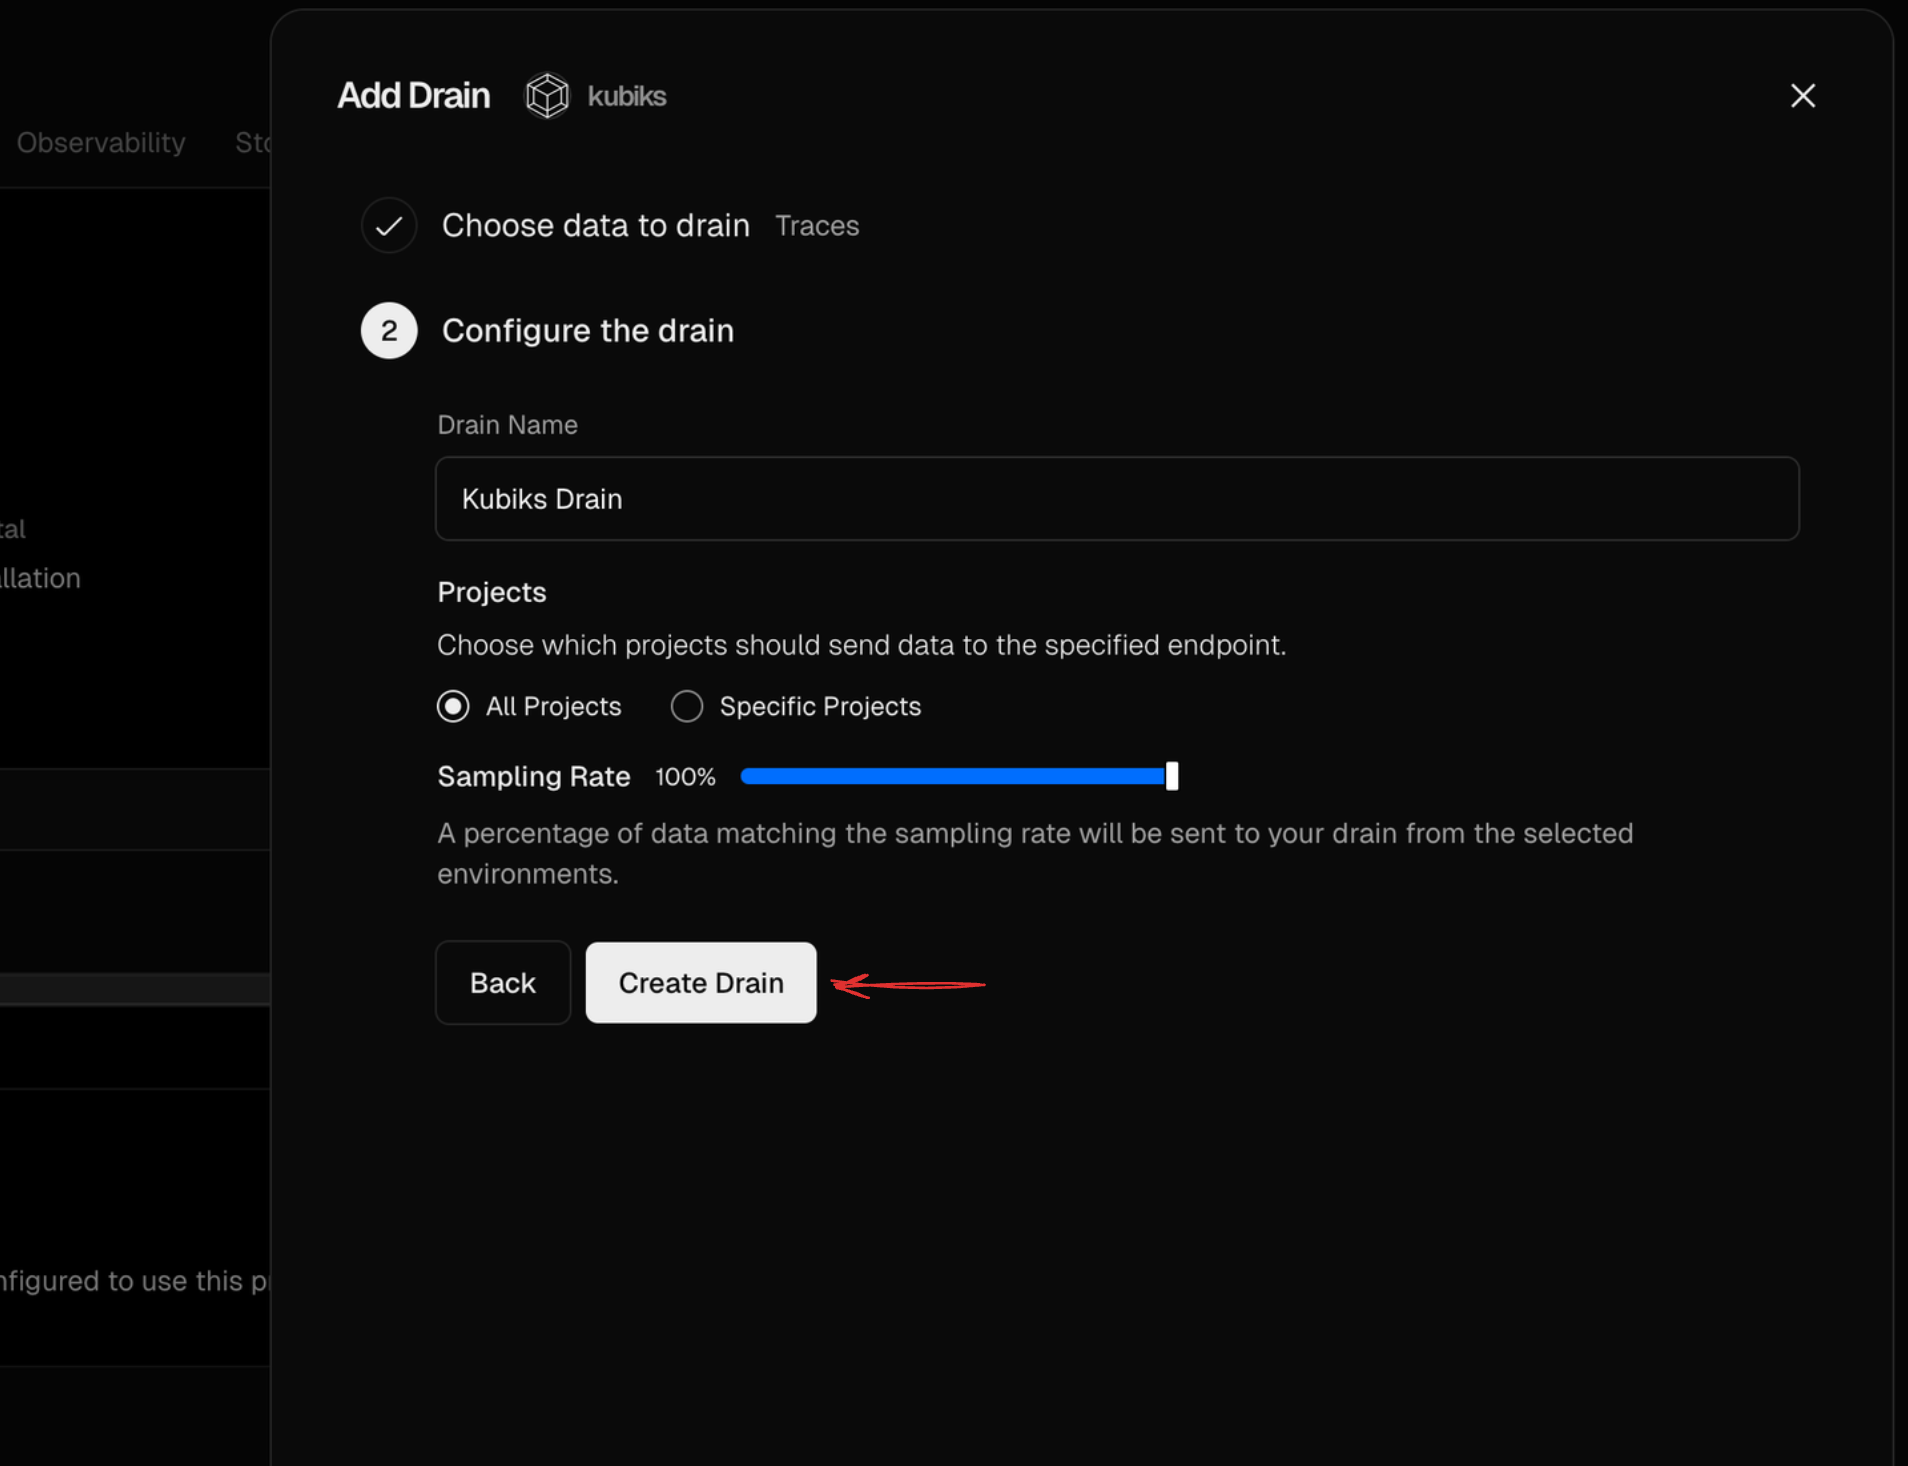
 Configure the drain settings and click **Create Drain** to complete the setup.
 ### 3. Install OpenTelemetry SDK
Install the required OpenTelemetry packages:
```bash npm theme={null}
npm install @vercel/otel @opentelemetry/api @opentelemetry/api-logs
```
```bash pnpm theme={null}
pnpm add @vercel/otel @opentelemetry/api @opentelemetry/api-logs
```
```bash yarn theme={null}
yarn add @vercel/otel @opentelemetry/api @opentelemetry/api-logs
```
### 4. Configure Instrumentation
Create an `instrumentation.ts` file in your **project root**:
```typescript instrumentation.ts theme={null}
import { registerOTel } from '@vercel/otel';
export function register() {
registerOTel();
}
```
That's it! The `@vercel/otel` package automatically:
* Instruments HTTP requests, fetch calls, and Next.js internals
* Sends traces to Kubiks
## Instrument Your Dependencies
Enhance your observability by adding our OpenTelemetry SDKs for popular frameworks and services:
Trace all database queries and transactions
Monitor authentication flows and sessions
Track email delivery and operations
Monitor message queue operations
Trace billing and payment flows
Explore all available SDKs
## Troubleshooting
Verify that **Trace Drains are enabled** in your Vercel project settings.
Navigate to **Settings** → **Integrations** → **OpenTelemetry** and confirm the Kubiks endpoint is configured.
**Log drains are required** for Kubiks to work properly.
1. Navigate to Vercel **Settings** → **Log Drains**
2. Verify the Kubiks endpoint is listed and active
3. If missing, reinstall the Kubiks integration
4. Check the log drain status indicator (should be green/active)
## Resources
View your application traces and metrics
Install the Kubiks integration
### 3. Install OpenTelemetry SDK
Install the required OpenTelemetry packages:
```bash npm theme={null}
npm install @vercel/otel @opentelemetry/api @opentelemetry/api-logs
```
```bash pnpm theme={null}
pnpm add @vercel/otel @opentelemetry/api @opentelemetry/api-logs
```
```bash yarn theme={null}
yarn add @vercel/otel @opentelemetry/api @opentelemetry/api-logs
```
### 4. Configure Instrumentation
Create an `instrumentation.ts` file in your **project root**:
```typescript instrumentation.ts theme={null}
import { registerOTel } from '@vercel/otel';
export function register() {
registerOTel();
}
```
That's it! The `@vercel/otel` package automatically:
* Instruments HTTP requests, fetch calls, and Next.js internals
* Sends traces to Kubiks
## Instrument Your Dependencies
Enhance your observability by adding our OpenTelemetry SDKs for popular frameworks and services:
Trace all database queries and transactions
Monitor authentication flows and sessions
Track email delivery and operations
Monitor message queue operations
Trace billing and payment flows
Explore all available SDKs
## Troubleshooting
Verify that **Trace Drains are enabled** in your Vercel project settings.
Navigate to **Settings** → **Integrations** → **OpenTelemetry** and confirm the Kubiks endpoint is configured.
**Log drains are required** for Kubiks to work properly.
1. Navigate to Vercel **Settings** → **Log Drains**
2. Verify the Kubiks endpoint is listed and active
3. If missing, reinstall the Kubiks integration
4. Check the log drain status indicator (should be green/active)
## Resources
View your application traces and metrics
Install the Kubiks integration