> ## Documentation Index
> Fetch the complete documentation index at: https://docs.kubiks.ai/llms.txt
> Use this file to discover all available pages before exploring further.
# Inbound
> OpenTelemetry instrumentation for inbound HTTP requests
## Overview
`@kubiks/otel-inbound` provides comprehensive OpenTelemetry instrumentation for inbound HTTP requests. Automatically trace all incoming requests to your application with detailed metadata about request/response cycles, headers, status codes, and performance metrics.
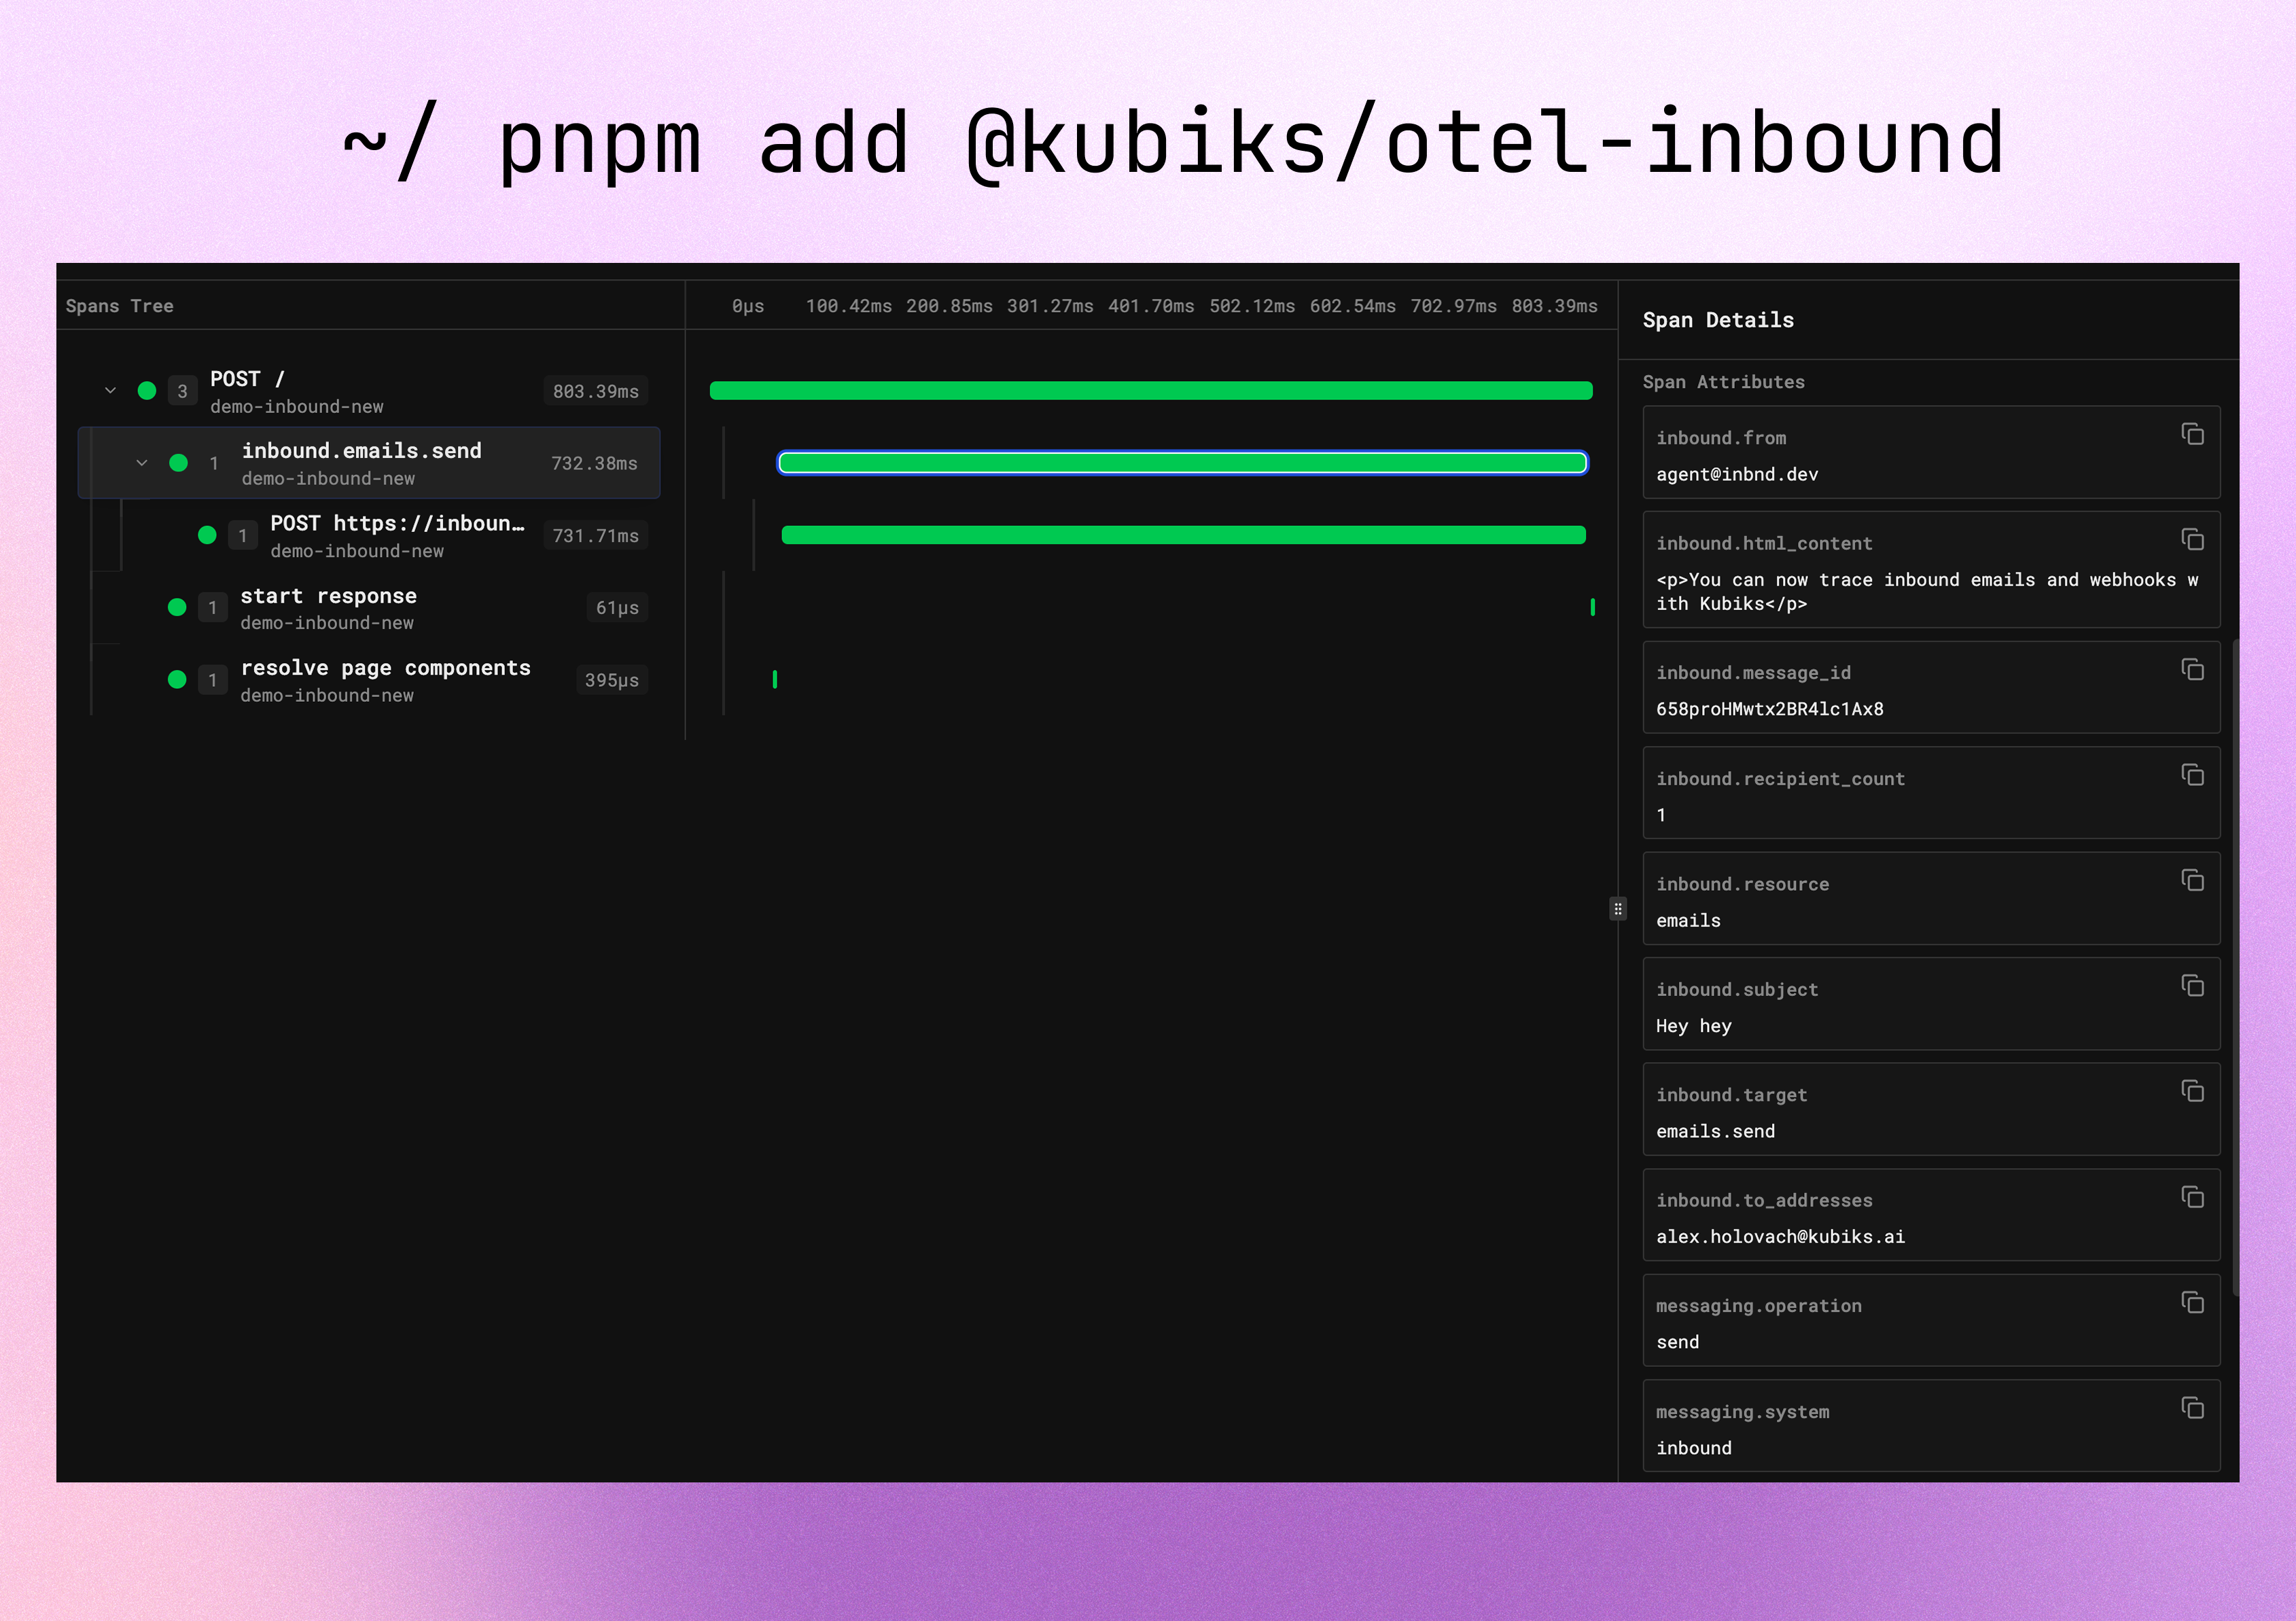 Visualize every inbound HTTP request with detailed span information including URL, method, headers, response status, and timing.
## Installation
```bash npm theme={null}
npm install @kubiks/otel-inbound
```
```bash pnpm theme={null}
pnpm add @kubiks/otel-inbound
```
```bash yarn theme={null}
yarn add @kubiks/otel-inbound
```
**Peer Dependencies:** `@opentelemetry/api` >= 1.9.0
## Supported Frameworks
Works with any TypeScript framework and Node.js runtime:
App Router & Pages Router
High-performance server
Enterprise framework
Classic Node.js server
Full-stack framework
Modern web framework
## Supported Platforms
Works with any observability platform that supports OpenTelemetry:
* [Kubiks](https://kubiks.ai)
* [Sentry](https://sentry.io)
* [Axiom](https://axiom.co)
* [Datadog](https://www.datadoghq.com)
* [New Relic](https://newrelic.com)
* [SigNoz](https://signoz.io)
* And many more...
## Quick Start
Use `InboundInstrumentation` to automatically trace all incoming HTTP requests:
```typescript theme={null}
import { InboundInstrumentation } from '@kubiks/otel-inbound';
import { registerOTel } from '@vercel/otel';
// Register OpenTelemetry with Inbound instrumentation
export function register() {
registerOTel({
serviceName: 'your-app',
instrumentations: [
new InboundInstrumentation(),
],
});
}
// That's it! All inbound HTTP requests are now automatically traced
```
This is zero-config—just add the instrumentation and all inbound requests are automatically traced with no code changes required!
## Configuration Options
```typescript theme={null}
new InboundInstrumentation({
captureHeaders: true, // Capture request/response headers (default: true)
captureBody: false, // Capture request/response body (default: false)
maxBodyLength: 1000, // Max body length to capture (default: 1000)
ignorePaths: ['/health'], // Paths to ignore (default: [])
ignoreUserAgents: [], // User agents to ignore (default: [])
captureQueryString: true, // Include query strings (default: true)
})
```
By default, headers and query strings are captured but not request/response bodies. Enable `captureBody` carefully as it can expose sensitive data.
## What You Get
Each inbound HTTP request automatically creates a span with rich telemetry data:
* **Span name**: HTTP method + route (e.g., `GET /api/users`)
* **HTTP method**: GET, POST, PUT, DELETE, etc.
* **URL**: Full request URL including query parameters
* **Route**: Matched route pattern
* **Status code**: Response status code (200, 404, 500, etc.)
* **Duration**: Total request/response time
* Request headers (configurable)
* Query parameters
* Request body (optional)
* User agent
* Client IP address
* Content type and length
* Response status code
* Response headers (configurable)
* Response body (optional)
* Content type and length
* Total request duration
* Time to first byte
* Response size
* Exceptions are recorded with stack traces
* Proper span status (OK, ERROR)
* Error messages and HTTP status codes
* Failed request details
## Span Attributes
The instrumentation adds the following attributes to each span following [OpenTelemetry semantic conventions](https://opentelemetry.io/docs/specs/semconv/http/):
| Attribute | Description | Example |
| ------------------------------ | --------------------- | -------------------------------------- |
| `http.method` | HTTP method | `GET` |
| `http.url` | Full URL | `https://api.example.com/users?page=1` |
| `http.route` | Route pattern | `/api/users` |
| `http.status_code` | Response status | `200` |
| `http.user_agent` | Client user agent | `Mozilla/5.0...` |
| `http.client_ip` | Client IP | `192.168.1.1` |
| `http.request_content_length` | Request size (bytes) | `1024` |
| `http.response_content_length` | Response size (bytes) | `2048` |
## Usage Examples
### Basic HTTP Tracing
```typescript Next.js App Router theme={null}
// app/api/users/route.ts
import { NextRequest, NextResponse } from 'next/server';
// All requests are automatically traced
export async function GET(request: NextRequest) {
const users = await fetchUsers();
return NextResponse.json(users);
}
export async function POST(request: NextRequest) {
const body = await request.json();
const user = await createUser(body);
return NextResponse.json(user, { status: 201 });
}
```
```typescript Next.js Pages Router theme={null}
// pages/api/users.ts
import type { NextApiRequest, NextApiResponse } from 'next';
// All requests are automatically traced
export default async function handler(
req: NextApiRequest,
res: NextApiResponse
) {
if (req.method === 'GET') {
const users = await fetchUsers();
return res.status(200).json(users);
}
if (req.method === 'POST') {
const user = await createUser(req.body);
return res.status(201).json(user);
}
return res.status(405).json({ error: 'Method not allowed' });
}
```
### Custom Configuration
```typescript theme={null}
import { InboundInstrumentation } from '@kubiks/otel-inbound';
import { registerOTel } from '@vercel/otel';
export function register() {
registerOTel({
serviceName: 'your-app',
instrumentations: [
new InboundInstrumentation({
// Capture headers except sensitive ones
captureHeaders: true,
// Don't trace health checks
ignorePaths: ['/health', '/ping', '/metrics'],
// Don't trace monitoring bots
ignoreUserAgents: ['UptimeRobot', 'Pingdom'],
// Capture query strings for analytics
captureQueryString: true,
// Don't capture request bodies (may contain sensitive data)
captureBody: false,
}),
],
});
}
```
### Error Handling
```typescript theme={null}
// app/api/error-test/route.ts
import { NextRequest, NextResponse } from 'next/server';
export async function GET(request: NextRequest) {
try {
// This error will be captured in the trace
throw new Error('Something went wrong');
} catch (error) {
// Error details are automatically added to the span
return NextResponse.json(
{ error: 'Internal server error' },
{ status: 500 }
);
}
}
```
## Complete Integration Example
Here's a complete example with Inbound instrumentation in a Next.js application:
```typescript instrumentation.ts theme={null}
import { registerOTel } from '@vercel/otel';
import { InboundInstrumentation } from '@kubiks/otel-inbound';
export function register() {
registerOTel({
serviceName: 'my-next-app',
instrumentations: [
new InboundInstrumentation({
captureHeaders: true,
ignorePaths: ['/health', '/_next'],
captureQueryString: true,
}),
],
});
}
```
```typescript app/api/users/[id]/route.ts theme={null}
import { NextRequest, NextResponse } from 'next/server';
// GET /api/users/123 - automatically traced
export async function GET(
request: NextRequest,
{ params }: { params: { id: string } }
) {
const user = await fetchUser(params.id);
if (!user) {
return NextResponse.json(
{ error: 'User not found' },
{ status: 404 }
);
}
return NextResponse.json(user);
}
// PUT /api/users/123 - automatically traced
export async function PUT(
request: NextRequest,
{ params }: { params: { id: string } }
) {
const body = await request.json();
const user = await updateUser(params.id, body);
return NextResponse.json(user);
}
// DELETE /api/users/123 - automatically traced
export async function DELETE(
request: NextRequest,
{ params }: { params: { id: string } }
) {
await deleteUser(params.id);
return NextResponse.json({ success: true });
}
```
## Best Practices
Be careful with capturing headers and bodies:
```typescript theme={null}
new InboundInstrumentation({
captureHeaders: true,
captureBody: false, // Bodies may contain sensitive data
// Filter sensitive headers in your collector/exporter
})
```
Exclude monitoring endpoints to reduce noise:
```typescript theme={null}
new InboundInstrumentation({
ignorePaths: [
'/health',
'/ping',
'/metrics',
'/_next/static',
],
})
```
Use traces to identify slow endpoints and optimize them:
* Look for high-duration spans
* Identify N+1 query problems
* Optimize database queries
* Add caching where appropriate
Configure alerts for high error rates or slow responses based on span data.
## Performance Considerations
The instrumentation adds minimal overhead (\~1ms per request) for tracing operations.
Use sampling for high-traffic applications:
```typescript theme={null}
import { TraceIdRatioBasedSampler } from '@opentelemetry/sdk-trace-base';
registerOTel({
serviceName: 'your-app',
sampler: new TraceIdRatioBasedSampler(0.1), // Sample 10% of traces
});
```
Don't trace static assets to reduce volume:
```typescript theme={null}
new InboundInstrumentation({
ignorePaths: [
'/_next/static',
'/static',
'/favicon.ico',
'/*.png',
],
})
```
## Troubleshooting
Ensure OpenTelemetry is initialized before the server starts:
```typescript theme={null}
// In instrumentation.ts or instrumentation.node.ts
export function register() {
registerOTel({
serviceName: 'your-app',
instrumentations: [new InboundInstrumentation()],
});
}
```
Check that `captureHeaders` is enabled:
```typescript theme={null}
new InboundInstrumentation({
captureHeaders: true,
})
```
Check if they're in the ignore list:
```typescript theme={null}
new InboundInstrumentation({
ignorePaths: ['/health'], // These paths won't be traced
})
```
Consider sampling or ignoring more paths:
```typescript theme={null}
new InboundInstrumentation({
ignorePaths: [
'/health',
'/_next',
'/static',
],
})
```
## Resources
Learn about HTTP semantic conventions
View source code and examples
View package on npm
Found a bug? Let us know!
## License
MIT
Visualize every inbound HTTP request with detailed span information including URL, method, headers, response status, and timing.
## Installation
```bash npm theme={null}
npm install @kubiks/otel-inbound
```
```bash pnpm theme={null}
pnpm add @kubiks/otel-inbound
```
```bash yarn theme={null}
yarn add @kubiks/otel-inbound
```
**Peer Dependencies:** `@opentelemetry/api` >= 1.9.0
## Supported Frameworks
Works with any TypeScript framework and Node.js runtime:
App Router & Pages Router
High-performance server
Enterprise framework
Classic Node.js server
Full-stack framework
Modern web framework
## Supported Platforms
Works with any observability platform that supports OpenTelemetry:
* [Kubiks](https://kubiks.ai)
* [Sentry](https://sentry.io)
* [Axiom](https://axiom.co)
* [Datadog](https://www.datadoghq.com)
* [New Relic](https://newrelic.com)
* [SigNoz](https://signoz.io)
* And many more...
## Quick Start
Use `InboundInstrumentation` to automatically trace all incoming HTTP requests:
```typescript theme={null}
import { InboundInstrumentation } from '@kubiks/otel-inbound';
import { registerOTel } from '@vercel/otel';
// Register OpenTelemetry with Inbound instrumentation
export function register() {
registerOTel({
serviceName: 'your-app',
instrumentations: [
new InboundInstrumentation(),
],
});
}
// That's it! All inbound HTTP requests are now automatically traced
```
This is zero-config—just add the instrumentation and all inbound requests are automatically traced with no code changes required!
## Configuration Options
```typescript theme={null}
new InboundInstrumentation({
captureHeaders: true, // Capture request/response headers (default: true)
captureBody: false, // Capture request/response body (default: false)
maxBodyLength: 1000, // Max body length to capture (default: 1000)
ignorePaths: ['/health'], // Paths to ignore (default: [])
ignoreUserAgents: [], // User agents to ignore (default: [])
captureQueryString: true, // Include query strings (default: true)
})
```
By default, headers and query strings are captured but not request/response bodies. Enable `captureBody` carefully as it can expose sensitive data.
## What You Get
Each inbound HTTP request automatically creates a span with rich telemetry data:
* **Span name**: HTTP method + route (e.g., `GET /api/users`)
* **HTTP method**: GET, POST, PUT, DELETE, etc.
* **URL**: Full request URL including query parameters
* **Route**: Matched route pattern
* **Status code**: Response status code (200, 404, 500, etc.)
* **Duration**: Total request/response time
* Request headers (configurable)
* Query parameters
* Request body (optional)
* User agent
* Client IP address
* Content type and length
* Response status code
* Response headers (configurable)
* Response body (optional)
* Content type and length
* Total request duration
* Time to first byte
* Response size
* Exceptions are recorded with stack traces
* Proper span status (OK, ERROR)
* Error messages and HTTP status codes
* Failed request details
## Span Attributes
The instrumentation adds the following attributes to each span following [OpenTelemetry semantic conventions](https://opentelemetry.io/docs/specs/semconv/http/):
| Attribute | Description | Example |
| ------------------------------ | --------------------- | -------------------------------------- |
| `http.method` | HTTP method | `GET` |
| `http.url` | Full URL | `https://api.example.com/users?page=1` |
| `http.route` | Route pattern | `/api/users` |
| `http.status_code` | Response status | `200` |
| `http.user_agent` | Client user agent | `Mozilla/5.0...` |
| `http.client_ip` | Client IP | `192.168.1.1` |
| `http.request_content_length` | Request size (bytes) | `1024` |
| `http.response_content_length` | Response size (bytes) | `2048` |
## Usage Examples
### Basic HTTP Tracing
```typescript Next.js App Router theme={null}
// app/api/users/route.ts
import { NextRequest, NextResponse } from 'next/server';
// All requests are automatically traced
export async function GET(request: NextRequest) {
const users = await fetchUsers();
return NextResponse.json(users);
}
export async function POST(request: NextRequest) {
const body = await request.json();
const user = await createUser(body);
return NextResponse.json(user, { status: 201 });
}
```
```typescript Next.js Pages Router theme={null}
// pages/api/users.ts
import type { NextApiRequest, NextApiResponse } from 'next';
// All requests are automatically traced
export default async function handler(
req: NextApiRequest,
res: NextApiResponse
) {
if (req.method === 'GET') {
const users = await fetchUsers();
return res.status(200).json(users);
}
if (req.method === 'POST') {
const user = await createUser(req.body);
return res.status(201).json(user);
}
return res.status(405).json({ error: 'Method not allowed' });
}
```
### Custom Configuration
```typescript theme={null}
import { InboundInstrumentation } from '@kubiks/otel-inbound';
import { registerOTel } from '@vercel/otel';
export function register() {
registerOTel({
serviceName: 'your-app',
instrumentations: [
new InboundInstrumentation({
// Capture headers except sensitive ones
captureHeaders: true,
// Don't trace health checks
ignorePaths: ['/health', '/ping', '/metrics'],
// Don't trace monitoring bots
ignoreUserAgents: ['UptimeRobot', 'Pingdom'],
// Capture query strings for analytics
captureQueryString: true,
// Don't capture request bodies (may contain sensitive data)
captureBody: false,
}),
],
});
}
```
### Error Handling
```typescript theme={null}
// app/api/error-test/route.ts
import { NextRequest, NextResponse } from 'next/server';
export async function GET(request: NextRequest) {
try {
// This error will be captured in the trace
throw new Error('Something went wrong');
} catch (error) {
// Error details are automatically added to the span
return NextResponse.json(
{ error: 'Internal server error' },
{ status: 500 }
);
}
}
```
## Complete Integration Example
Here's a complete example with Inbound instrumentation in a Next.js application:
```typescript instrumentation.ts theme={null}
import { registerOTel } from '@vercel/otel';
import { InboundInstrumentation } from '@kubiks/otel-inbound';
export function register() {
registerOTel({
serviceName: 'my-next-app',
instrumentations: [
new InboundInstrumentation({
captureHeaders: true,
ignorePaths: ['/health', '/_next'],
captureQueryString: true,
}),
],
});
}
```
```typescript app/api/users/[id]/route.ts theme={null}
import { NextRequest, NextResponse } from 'next/server';
// GET /api/users/123 - automatically traced
export async function GET(
request: NextRequest,
{ params }: { params: { id: string } }
) {
const user = await fetchUser(params.id);
if (!user) {
return NextResponse.json(
{ error: 'User not found' },
{ status: 404 }
);
}
return NextResponse.json(user);
}
// PUT /api/users/123 - automatically traced
export async function PUT(
request: NextRequest,
{ params }: { params: { id: string } }
) {
const body = await request.json();
const user = await updateUser(params.id, body);
return NextResponse.json(user);
}
// DELETE /api/users/123 - automatically traced
export async function DELETE(
request: NextRequest,
{ params }: { params: { id: string } }
) {
await deleteUser(params.id);
return NextResponse.json({ success: true });
}
```
## Best Practices
Be careful with capturing headers and bodies:
```typescript theme={null}
new InboundInstrumentation({
captureHeaders: true,
captureBody: false, // Bodies may contain sensitive data
// Filter sensitive headers in your collector/exporter
})
```
Exclude monitoring endpoints to reduce noise:
```typescript theme={null}
new InboundInstrumentation({
ignorePaths: [
'/health',
'/ping',
'/metrics',
'/_next/static',
],
})
```
Use traces to identify slow endpoints and optimize them:
* Look for high-duration spans
* Identify N+1 query problems
* Optimize database queries
* Add caching where appropriate
Configure alerts for high error rates or slow responses based on span data.
## Performance Considerations
The instrumentation adds minimal overhead (\~1ms per request) for tracing operations.
Use sampling for high-traffic applications:
```typescript theme={null}
import { TraceIdRatioBasedSampler } from '@opentelemetry/sdk-trace-base';
registerOTel({
serviceName: 'your-app',
sampler: new TraceIdRatioBasedSampler(0.1), // Sample 10% of traces
});
```
Don't trace static assets to reduce volume:
```typescript theme={null}
new InboundInstrumentation({
ignorePaths: [
'/_next/static',
'/static',
'/favicon.ico',
'/*.png',
],
})
```
## Troubleshooting
Ensure OpenTelemetry is initialized before the server starts:
```typescript theme={null}
// In instrumentation.ts or instrumentation.node.ts
export function register() {
registerOTel({
serviceName: 'your-app',
instrumentations: [new InboundInstrumentation()],
});
}
```
Check that `captureHeaders` is enabled:
```typescript theme={null}
new InboundInstrumentation({
captureHeaders: true,
})
```
Check if they're in the ignore list:
```typescript theme={null}
new InboundInstrumentation({
ignorePaths: ['/health'], // These paths won't be traced
})
```
Consider sampling or ignoring more paths:
```typescript theme={null}
new InboundInstrumentation({
ignorePaths: [
'/health',
'/_next',
'/static',
],
})
```
## Resources
Learn about HTTP semantic conventions
View source code and examples
View package on npm
Found a bug? Let us know!
## License
MIT